
Capital Southwest Corp Advances Equity Program and Debt Strategy to Fuel Portfolio Expansion
Recent filings reveal expanded equity issuance capacity and strategic debt refinancings underpinning Capital Southwest's portfolio growth ambitions within regulatory leverage limits.
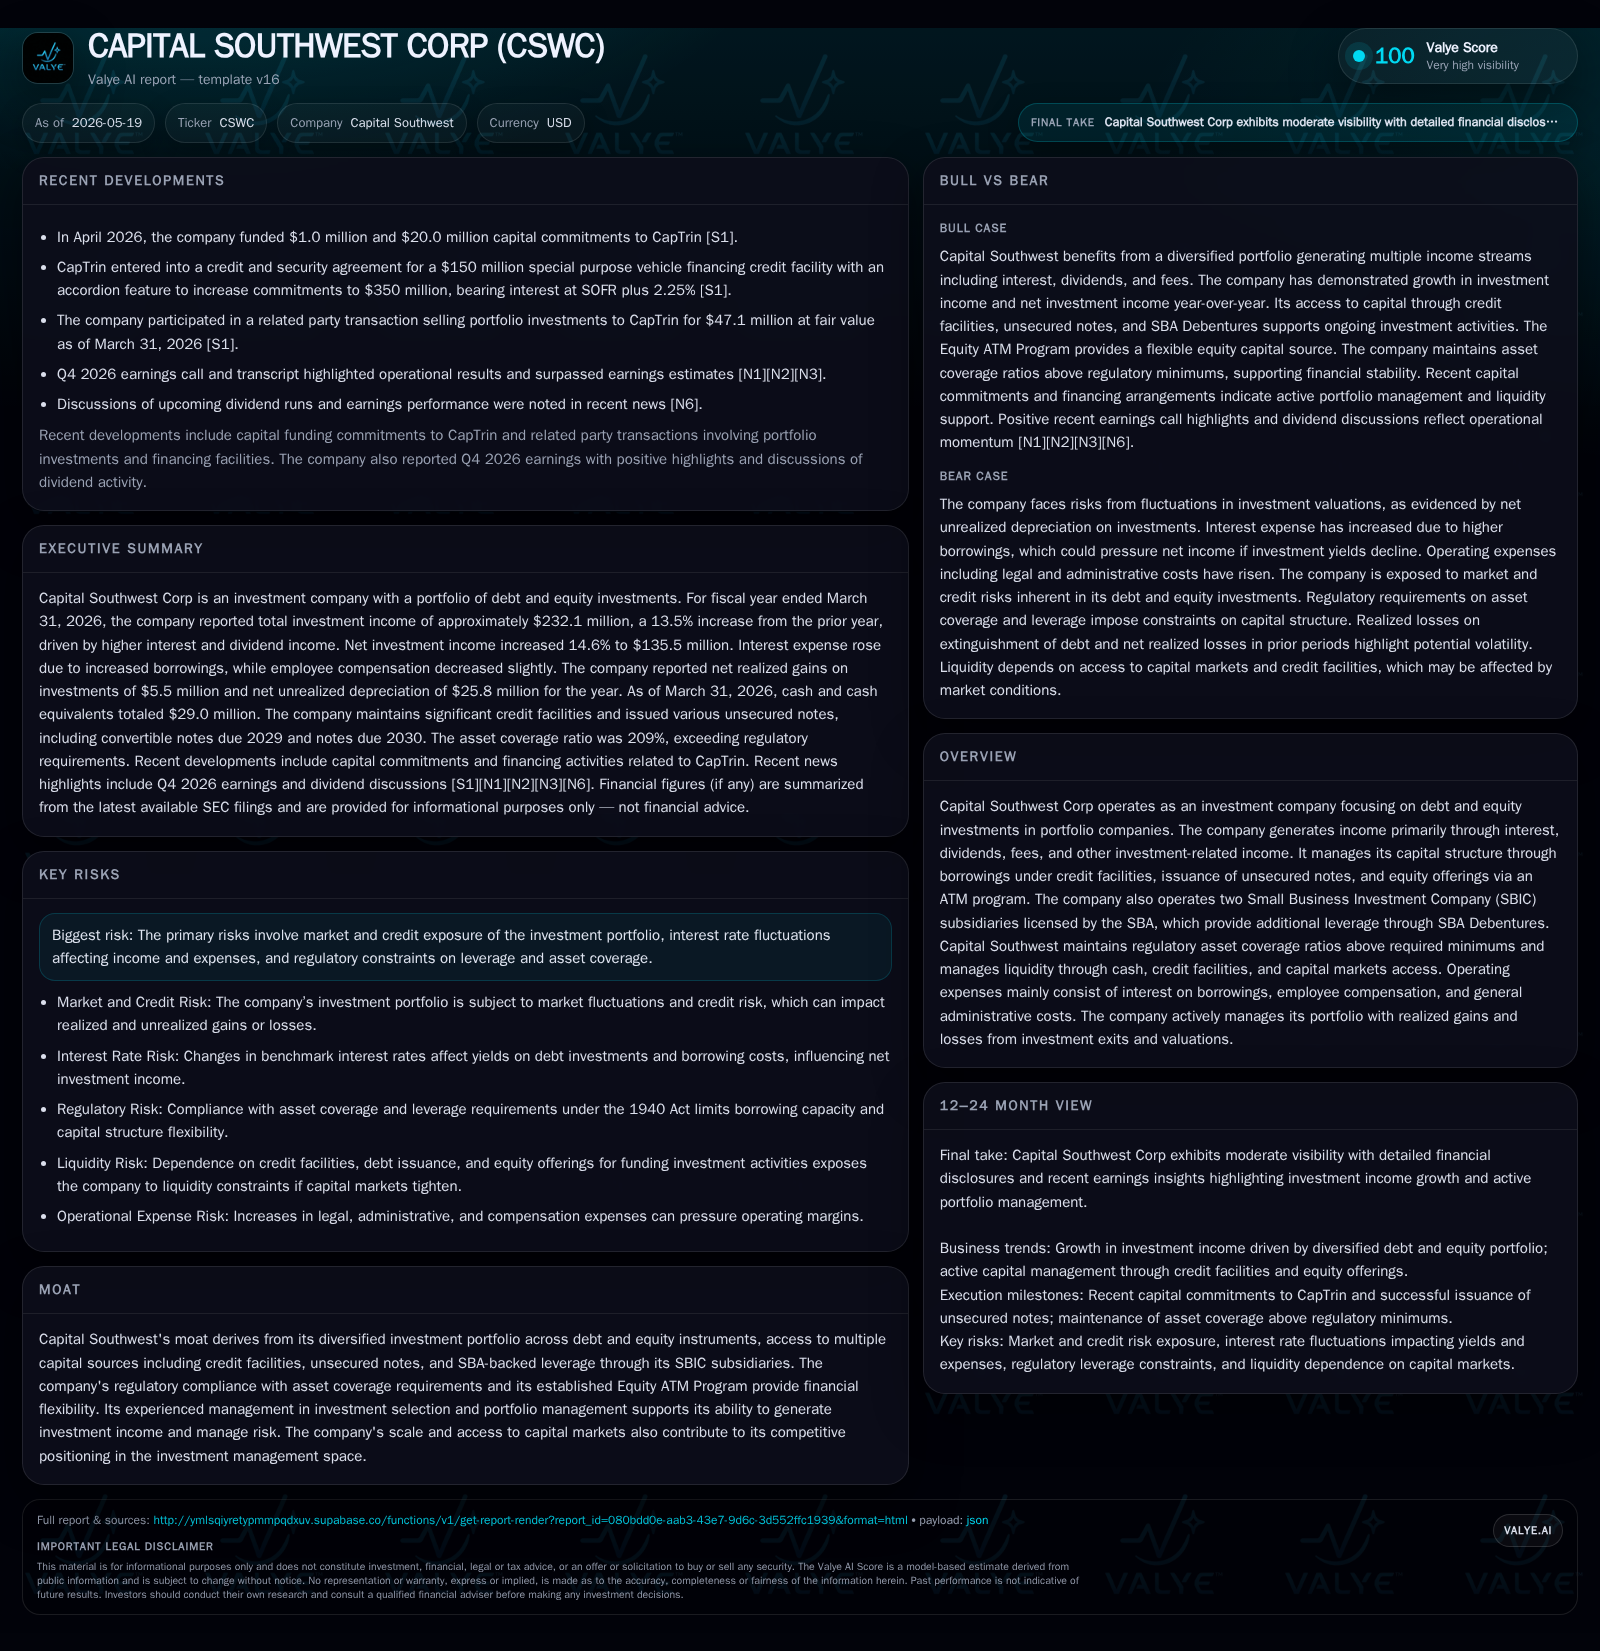
Capital Southwest Corporation (CSWC) reported a robust increase in investment income for the fiscal year ending March 31, 2026, supported by a growing debt investment portfolio despite yield compression. The company notably enhanced its capital flexibility through a significant raise in its Equity ATM Program capacity to $2 billion, facilitating ongoing equity capital raises. Concurrently, CSWC has actively managed its debt profile with new unsecured note issuances and redemptions to optimize cost and maturity profiles. Its dual SBIC subsidiaries continue to provide SBA-backed leverage expansion, reinforcing overall liquidity and investment firepower within the asset coverage framework imposed by the Investment Company Act of 1940. These moves place CSWC in a strong position to capitalize on middle-market debt and equity opportunities amid competitive pressure on yields.
Latest Quarterly Operating Performance Highlights
Capital Southwest's latest quarterly filing dated February 2, 2026 [S2] reveals continued portfolio growth momentum supporting increased investment income despite a challenging yield environment. For the fiscal year ended March 31, 2026, total investment income rose by approximately $27.7 million or 13.5% year-over-year to $232.1 million [S1]. This improvement was primarily driven by a 20.3% increase in average monthly cost basis of debt investments from $1.49 billion to $1.79 billion, offset by a decline in weighted average yield from 11.7% to 10.8%, which reflects falling benchmark rates.
Dividend income surged to $12.7 million from $4.5 million the prior year as distributions from portfolio companies grew [S1]. Meanwhile, fee income saw modest gains while other income declined marginally due to lower interest on cash balances.
Operationally, interest expense increased by $11.7 million reflecting higher average borrowings outstanding; however, weighted average borrowing costs remained stable near 5.52% [S1]. Employee compensation declined due to absence of one-time charges incurred in the prior period but modest rises in bonus expenses partially offset this [S1]. General administrative expenses increased about 9.8%, driven by legal fees and expanding office-related costs.
A recent event filing dated May 19, 2026 [S3] disclosed an amendment increasing the maximum size of CSWC’s Equity ATM Program from $1 billion to $2 billion. This expanded program enables opportunistic equity sales through multiple sales agents, strengthening capital-raising flexibility.
Business Model Fundamentals: Investment Income Drivers
Capital Southwest operates as an externally managed business development company focusing on middle-market debt and equity investments [S1]. Revenue is generated primarily through interest on debt holdings (including PIK interest), dividends from equity positions, amortization of purchase discounts and fees associated with loans originated or acquired, plus fee income for asset servicing.
The portfolio is diversified across several debt instruments with floating-rate characteristics that are partially sensitive to benchmark rate fluctuations but also include PIK elements that add non-cash accruals enhancing yield sustainability [S1]. Dividend income growth reflects deeper equity stakes or successful exits yielding distributions that diversify revenue beyond fixed income returns.
Fee-related revenue stems largely from administrative services provided alongside lending activity and remains relatively stable but offers potential upside as new deals close or follow-ons occur [S1]
Regulatory Framework and Capital Structure Management
CSWC operates under Section 55(a) of the Investment Company Act of 1940 which limits senior security borrowings so that asset coverage must be at least 150% post-borrowing; additionally, CSWC’s Board imposes even stricter internal thresholds targeting no less than a 166% asset coverage ratio for senior securities issuance [S8].
Capital structure combines several layers:
- SBA-backed debentures issued by SBIC subsidiaries totaling approximately $271 million cumulatively drawn with staggered maturities beginning in September 2031 offering low-cost leverage backed by government guarantees [S15]
The Equity ATM Program provides flexible access to common equity capital up to an aggregate offering price of $2 billion following recent amendments executed May 19, 2026—doubling previous capacity enabling execution of incremental share sales opportunistically without dilutive block issuance risk [S3][S26]. Cumulatively since inception through March quarter-end, nearly $857 million net proceeds have been raised from ATM sales over more than 40 million shares at a weighted average price around $21.52 per share [S7].
Proactive liability management evidenced by recent redemption activity reduces refinancing risk concentrations while maintaining weighted average cost stability around mid-5% rates despite overall rising market rates seen during prior years [S15][S19]. This layered capital structure balances cost efficiency with maturity diversification within regulatory constraints.
Competitive Positioning and Industry Dynamics
Within the business development company sector focused on middle-market lending and private equity investments, Capital Southwest distinguishes itself through diversified capital sourcing combining institutional unsecured notes, SBA-guaranteed debenture leverage via its SBIC subsidiaries, sizeable credit facilities and an active equity ATM program allowing nimble capital raises aligned with market demand [S1][S3].
This multi-product capital platform affords CSWC financial flexibility uncommon among smaller peers dependent solely on traditional BDC structures or single capital channels.
Regulatory compliance with stringent asset coverage tests ensures prudent leverage use mitigating overextension risks while supporting sustainable portfolio growth—a competitive moat reinforced further by CSWC’s seasoned management team known for disciplined underwriting standards and active portfolio monitoring.
Yields across mid-market debt products face pressure from fluctuating benchmark rates and competitive marketplace liquidity but CSWC’s presence across varying instruments—from senior secured loans to mezzanine debt including equity components—imparts some pricing power through product mix optimization and fee enhancements.
Risk diversification across sectors along with geographic spread aims to limit concentration losses characteristic of smaller funds facing idiosyncratic credit volatility.
Growth Drivers: Portfolio Composition and Capital Deployment
Capital Southwest's growth hinges upon deploying incremental capital into middle-market companies requiring flexible financing solutions not fully served by banks or public markets [S1][N1][N2].
Substantial unfunded commitments totaling approximately $329 million as of March quarter-end indicate management’s confidence in sourcing pipeline opportunities expected to generate future income streams once funded [S9]
The increase in dividend income suggests maturing portfolio companies are generating distributable earnings enhancing equity stake value realizations alongside stable fee revenues linked to loan servicing volumes.
Expanded Equity ATM capacity coupled with accessible revolving credit facilities creates ample dry powder enabling swift responses to attractive transactions while maintaining balanced leverage under regulatory limits—the twin levers bolstering scalable portfolio expansion plans [S3]
Additionally, SBA Debenture leverage accessible via SBIC licensing enhances low-cost funding availability facilitating tactically advantaged acquisitions especially where longer term committed capital is beneficial [S15].
Competitive pressures among BDC peers vying for similar middle-market credits may push pricing down or require concessionary terms impacting overall return profiles; differentiation depends heavily on underwriting discipline amid this environment.
Liquidity risks related to ability or timing mismatches between capital raising activities (equity issuance or note offerings) versus funding demands require continuous management focus especially during volatile markets.
Key Upcoming Milestones and Monitoring Metrics
Watchpoints include:
- Execution pace against unapplied commitments signaling deal flow quality underlying near-term revenue growth potential.
- Utilization levels of credit facilities alongside status updates on SBIC debenture drawdowns reflecting leverage deployment efficiency.
- Actual proceeds raised under expanded Equity ATM Program informing balance sheet flexibility trends.
- Earnings call disclosures detailing portfolio performance metrics including non-accruals or impairments indicating credit health trajectory.
- Regulatory developments potentially affecting asset coverage calculations or SBIC program parameters influencing future borrowing capacity.
- Industry yield curves tracking benchmark shifts serving as barometer for reinvestment returns versus funding costs dynamics.
Financial Landscape: Snapshot of Income, Expenses, and Leverage
Based on fiscal year results ending March 31, 2026:
- Investment income totaled approximately $232.1 million representing a strong growth trajectory primarily from increased debt investments despite yield compression [S1][S23].
- Interest expense rose proportionally due to higher indebtedness but weighted average borrowing cost remained steady around mid-5% levels easing refinancing risk concerns [S23].
- Net investment income grew approximately 14.6% year-over-year reaching nearly $135.5 million supported also by tax provision reductions [S23].
- Total debt outstanding was about $1.15 billion offset by cash balances near $29 million yielding net debt roughly $1.12 billion as per latest figures at quarter close enhancing transparency into leverage positioning [F1].
- Cash generated from financing activities included proceeds from new convertible notes ($230 million), unsecured fixed-rate notes ($350 million), SBA Debenture issuances ($46.8 million), along with Equity ATM sales ($157.8 million net), collectively fueling investment activity while maturing older notes were redeemed smoothly minimizing disruptions [S5][S8].
It does not constitute investment advice or research views.
Disclaimer: This is research-only, informational analysis and not investment advice. It may include AI-generated interpretation and general industry context. Always verify important details using primary sources.

Comments