
Delta Air Lines’ Strategic Evolution Balances Growth and Operational Challenges
Delta integrates regulatory strengths, fleet renewal, and revenue diversity to advance growth while managing cost inflation and environmental regulation.
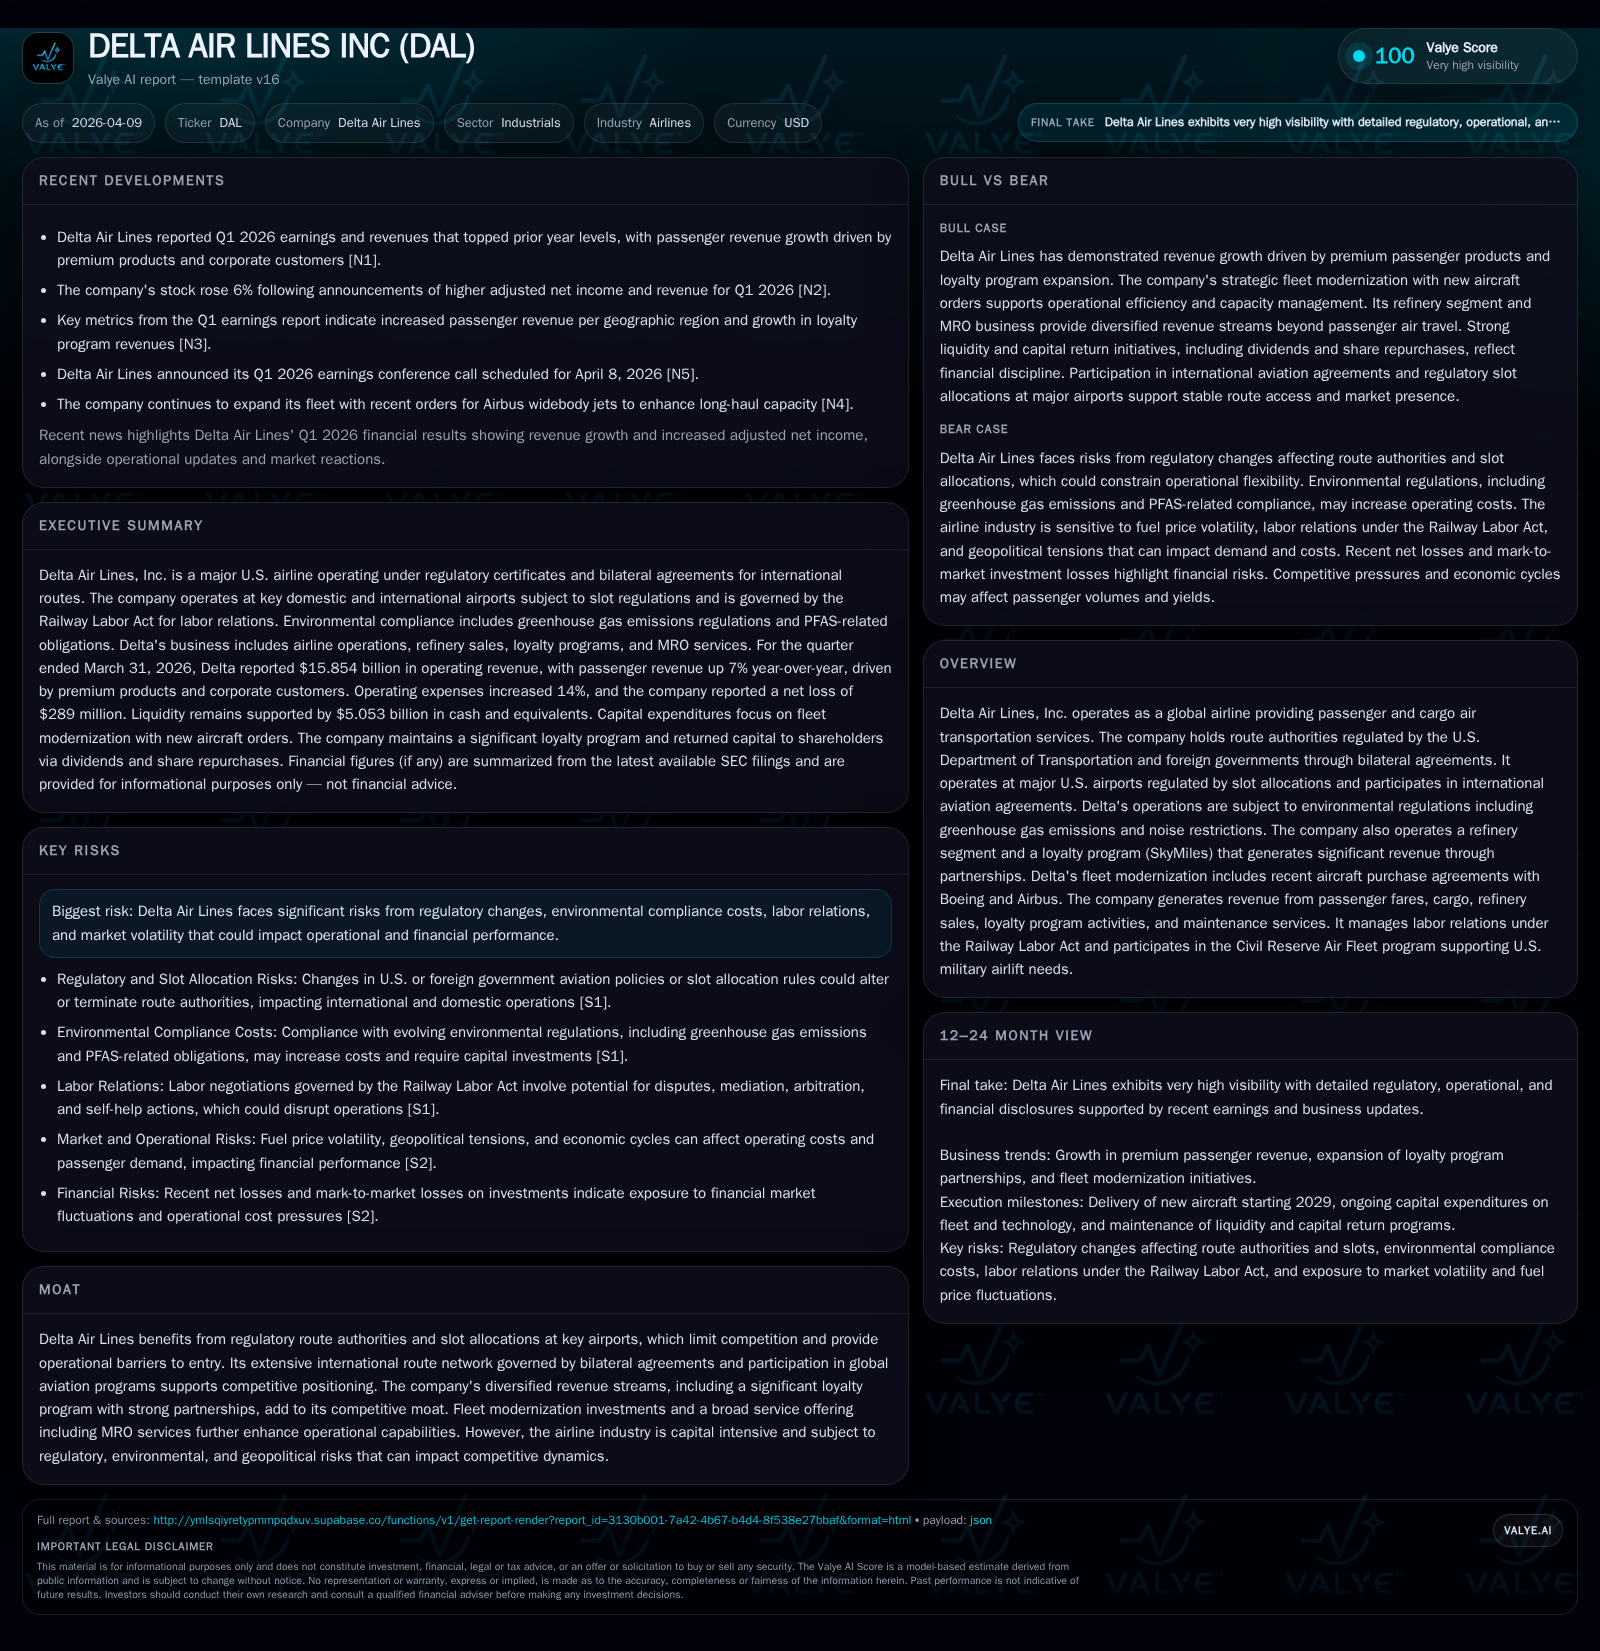
Delta Air Lines has demonstrated solid revenue growth fueled by passenger fares—particularly premium segments—and an expanding refinery business alongside its loyalty program. Operating income faced margin pressures from fuel, labor, and refinery costs during Q1 2026. Strategic investments in new Boeing and Airbus aircraft coupled with slot-controlled hubs underpin Delta's durable competitive position. While capital allocation favors dividend growth and debt management, rising regulatory and environmental compliance costs remain key challenges. Monitoring quarterly margin trends and regulatory developments will be critical for assessing near-term financial performance.
Revenue Expansion Amidst Rising Input Costs
Delta’s historical financial trajectory shows steady top-line growth from FY2018 through FY2025, culminating in reported revenues of approximately $47.4 billion in FY2025—a 4.9% increase over FY2024—with operating income marginally down by about 3% YoY to $5.8 billion [F1]. Net income more than recovered post-pandemic disruptions with a sharp rise of approximately 45% to $5 billion in FY2025, reflecting operational leverage despite cost headwinds.
In Q1 2026, total revenues grew by $1.8 billion versus the prior-year quarter—driven primarily by a $822 million (7%) increase in passenger revenues fueled by premium products favored by corporate customers, alongside a striking 41% surge in other revenues attributable mainly to higher third-party refinery sales and growth in the maintenance/repair/overhaul (MRO) segment [S2,N1]. This diverse revenue mix contributes to an adjusted TRASM uptick of nearly 9.4%, indicating effective pricing power even as market conditions tighten.
Operating income for Q1 declined slightly by $68 million compared to Q1 2025 due to inflationary pressures embedded within fuel expenses (about 18% of total operating costs), labor remuneration increases, and refinery-related operating costs [S2,N3]. Total operating expense rose sharply at a higher pace (14%) than revenue growth reflecting intensifying unit cost challenges.
Historical performance (annual)
| FY | Net ($bn) | CFO ($bn) | OpInc ($bn) | Capex ($bn) | Net YoY |
|---|---|---|---|---|---|
| 2025 | 5.0 | 8.3 | 5.8 | 4.5 | +44.8% |
| 2024 | 3.5 | 8.0 | 6.0 | 5.1 | -25.0% |
| 2023 | 4.6 | 6.5 | 5.5 | 5.3 | +249.7% |
| 2022 | 1.3 | 6.4 | 3.7 | 6.4 |
Source: SEC companyfacts cache [F1].
Capital returns and efficiency (annual)
| FY | Div ($mm) | FCF ($bn) | ROE% |
|---|---|---|---|
| 2025 | 440 | 3.8 | 24.0 |
| 2024 | 321 | 2.9 | 22.6 |
| 2023 | 128 | 1.1 | 41.5 |
| 2022 | 0 | -0.0 | 20.0 |
Source: SEC companyfacts cache [F1].
Data compiled from historical SEC filings XBRL data summarized [F1].
Fleet Modernization and Network Access as Growth Enablers
Central to Delta’s long-term strategy is its fleet renewal program leveraging contractual commitments with Boeing and Airbus announced early 2026: acquiring 30 Boeing 787-10s with an option for another 30 (deliveries starting in 2031), purchasing Airbus A330-900s and A350-900s with delivery schedules beginning in late-2020s, plus exercising options for additional Airbus A321neos starting deliveries also around 2029 [S11]. This mix aims to lower CASM (cost per available seat mile) through more fuel-efficient widebody and narrowbody aircraft.
Moreover, Delta’s operational foothold is reinforced by access to slot-controlled U.S airports such as LaGuardia (LGA), JFK, and Reagan National (DCA). These slots—which government authorities allocate—regulate flight frequency enabling Delta to maintain competitive service presence while limiting new entrants due to capacity constraints imposed by the FAA and international scheduling guidelines [S1,S26]. Such regulatory barriers create high switching costs for competitors seeking similar route authority or time-sensitive flight slots.
The airline also benefits from bilateral Open Skies agreements which facilitate unrestricted operation rights between U.S. markets and foreign jurisdictions—critical for global network scaling especially across Atlantic and Pacific routes where Delta has experienced notable revenue expansion [N1,S16].
Loyalty Program Contributions and Diversification of Revenue Streams
The SkyMiles loyalty program forms a substantial part of Delta’s other revenues beyond core air travel operations—specifically through long-term marketing agreements like the co-branded American Express credit card partnership that generated $2.2 billion in cash sales alone during Q1 2026 [S2,S5]. Revenue recognition follows relative selling price allocation methods according to GAAP controls: deferred revenue accounts track miles issued but unredeemed mostly expected within two years—a timing that imparts visibility into future passenger revenue conversion linked to loyalty redemptions [S1].
Additional streams include redemption-based travel awards driving passenger volumes plus ancillary brand-related revenues such as baggage waivers, lounge access fees recognized variably under passenger or other revenues depending on service type. This layered mechanism differentiates Delta’s cash flows from more commoditized ticket sales alone.
Cost Inflation and Margin Pressure in the March 2026 Quarter
While revenues expanded strongly during the March quarter, margin pressure was evident as total CASM rose by an estimated 13%, driven largely by escalating fuel prices amid broader supply-demand dynamics in global oil markets coupled with elevated labor costs tied to workforce contracts under the Railway Labor Act framework [S2,N3]. Non-fuel unit costs (“CASM-Ex”) increased near 6%, signaling broader inflation affecting maintenance, airport fees, security charges, and proprietary refinery expenses that grew sharply year-over-year.
Non-operationally, net expenses swelled due to marked-to-market losses on equity investment portfolios increasing overall financial expense burden in Q1 relative to last year’s quarter by roughly $466 million [S2].
Capital Allocation Priorities: Investments, Dividends, and Debt Management
From a capital deployment perspective, Delta maintained substantial investment activity with approximately $4.5 billion capex directed toward fleet acquisitions & technology upgrades though showing a slight decline versus FY2024 outlays which exceeded $5 billion [F1,S11]. Concurrently dividends resumed scaling steadily post-pandemic with full-year distributions hitting about $440 million for FY2025 compared to substantially lower prior payouts—and Board-approved share repurchase programs totaling up to $1 billion remain unexecuted so far into early 2026 quarters possibly due to capital preservation considerations amid cost pressures.
Debt profile adjustments included entering a $1.25 billion term loan facility early January used primarily to retire higher-cost Payroll Support Program loans aiding interest expense optimization; total reported debt stood below prior levels reflecting active amortization within revolving credit facilities maintaining liquidity above $8 billion combined cash equivalents and undrawn lines as of Q1 end [S4,S8,S11].
ROE approximated at around a robust 24% calculated by dividing FY2025 net income by equity levels per XBRL data underscores efficient capital use despite cyclical industry challenges [F1].
Regulatory Environment and Competitive Moats in Slot-Constrained Airports
Delta's entrenched position benefits heavily from legal frameworks regulating airport slots at congested hubs that restrict new entrant access or expansion—a structural moat buttressed further by bilateral international route authorities governed under DOT-issued certificates subject to renewal evaluations tied closely to service levels provided historically [S1,S26].
Nonetheless risks persist related to potential antitrust litigations including ongoing class action suits alleging capacity restraint practices across major US carriers which may impose fines or mandate operational changes adversely affecting strategic flexibility [S26].
Environmental Regulations and Their Implications for Future Operations
The company faces increasing compliance obligations stemming from federal EPA mandates targeting greenhouse gas emission reductions alongside noise abatement policies affecting major airport operations where Delta flies—requiring ongoing investments both CAPEX- and OPEX-wise into cleaner technologies and operational modifications such as sustainable aviation fuels uptake or fleet retrofitting initiatives detailed under environmental risk disclosures [S1,S26]. These factors add layers of cost complexity influencing future margin management.
Key Milestones to Monitor in Quarterly Performance Ahead
Looking forward into upcoming quarterly earnings announcements leadership commentary on margin trajectory given volatile jet fuel trends will be pivotal—as will updates concerning bilateral route renewals or slot reallocation modifications especially at the New York metropolitan area airports subject to dense competition and governmental oversight [N3,N1] (analysis). Debt refinancing progress including potential prepayments or adjustments to leverage metrics remains another focal point.
Financial Health Snapshots: Cash Flow Generation and Liquidity
Operational cash flows remained resilient generating $2.4 billion during Q1 largely propelled by solid ticket sales plus SkyMiles partner payments sustaining liquidity at comfortable levels near $8 billion combining cash equivalents & credit availability as reported end-March; free cash flow after capex was positive at about $1.2 billion indicating ongoing self-funding capacity albeit challenged by capital intensity inherent across aircraft investment cycles [S2,F1].
This analysis synthesizes publicly filed financial data alongside recent earnings commentary without offering investment advice or forecasts beyond disclosed company guidance or reported facts.
Disclaimer: This is research-only, informational analysis and not investment advice. It may include AI-generated interpretation and general industry context. Always verify important details using primary sources.
Comments