
First Northern Community Bancorp’s Steady Profit Rise and Regional Banking Strength in 2025
First Northern leverages its community bank model in northern and central California to sustain profit growth with strategic capital deployment.
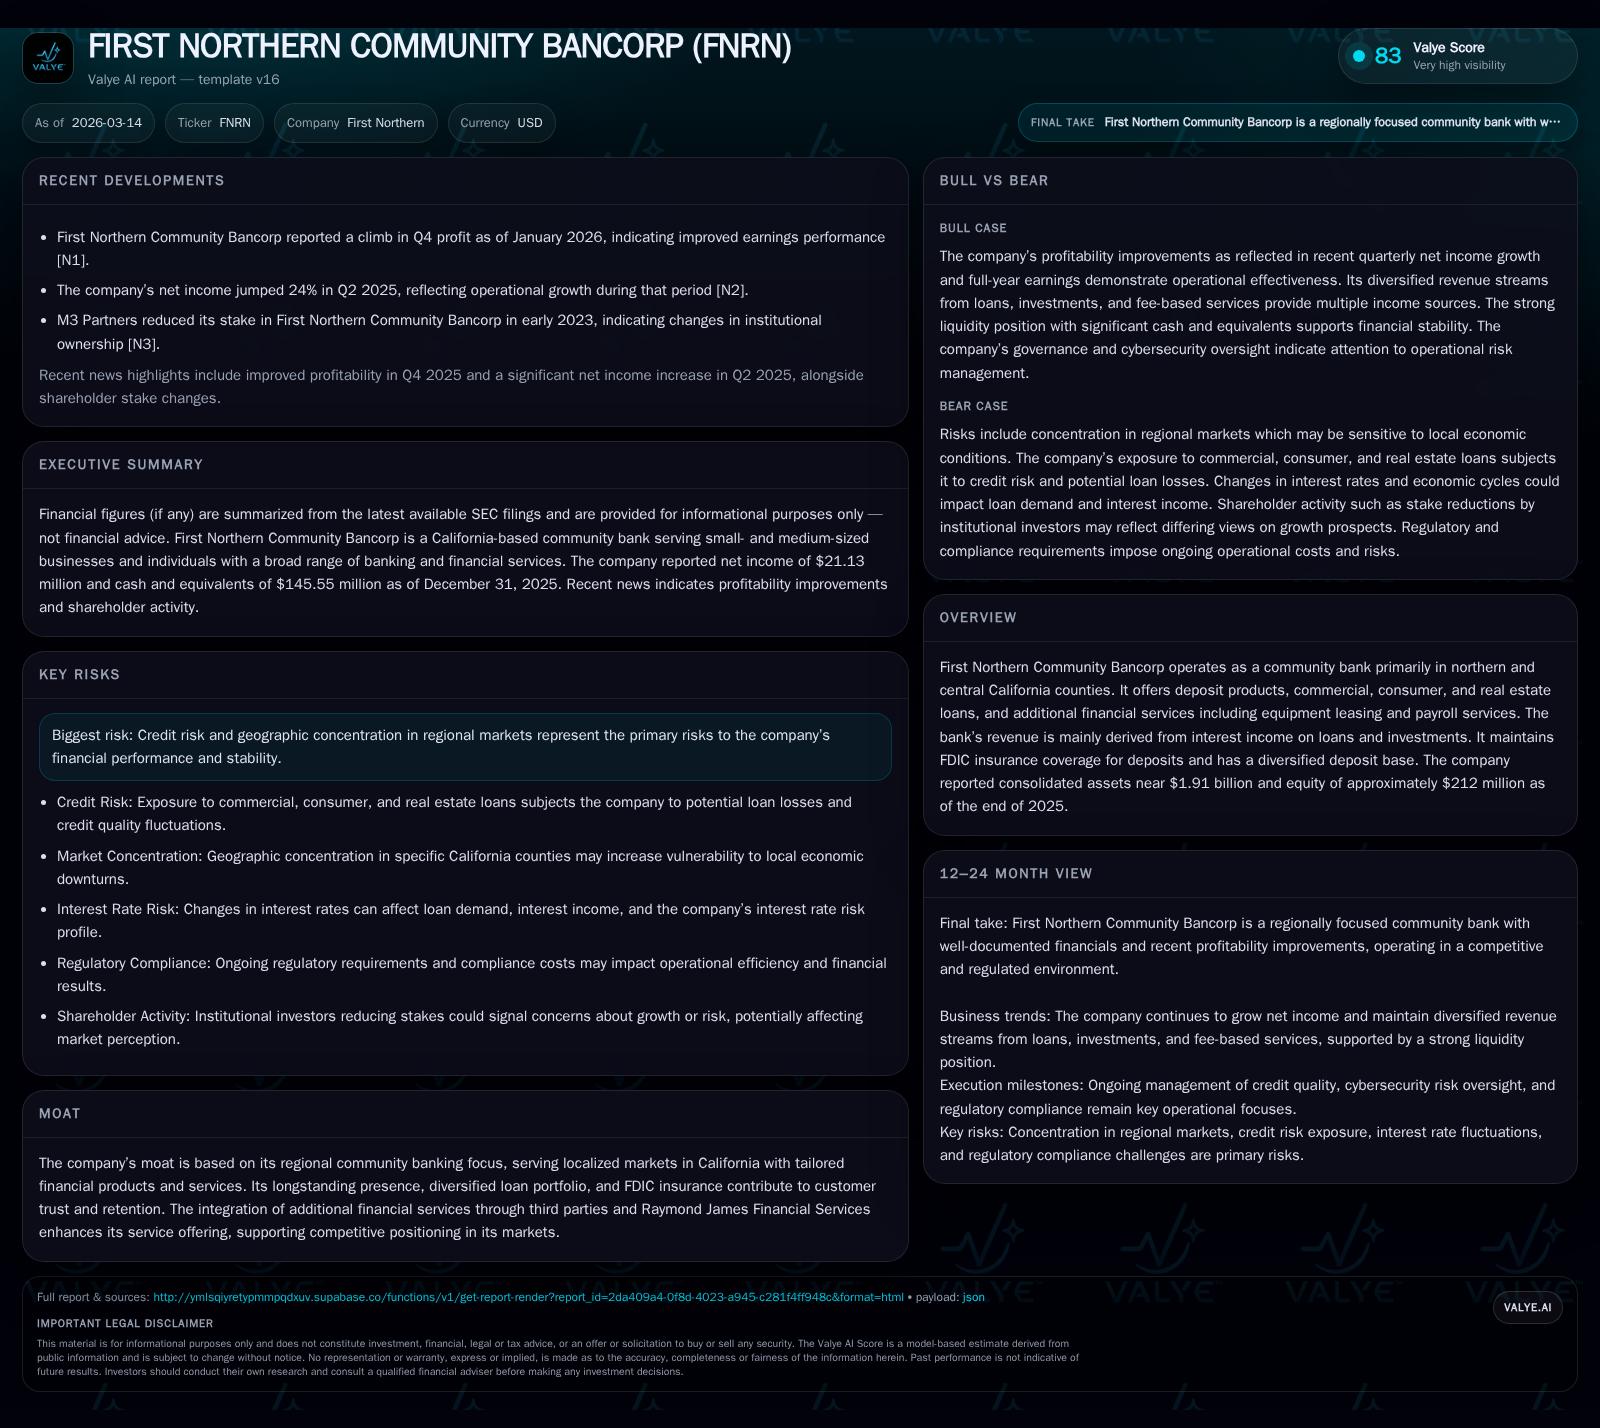
In 2025, First Northern Community Bancorp solidified its position as a regional banking leader through steady profitability gains driven by its localized deposit base and diversified loan portfolio. Despite a marked decline in operating cash flow and increased capital expenditures, the bank demonstrated disciplined capital allocation with rising equity and accelerated share buybacks. Credit risk remains manageable, though geographic concentration in California poses ongoing challenges. Monitoring loan growth and asset quality metrics will be essential for evaluating near-term performance.
Localized Banking Model Driving Revenue Growth
First Northern Community Bancorp fortifies its revenue foundation through a deeply entrenched regional banking model focused on northern and central California counties. The company's approach centers on FDIC-insured diversified deposits that provide stable funding sources critical for lending operations [F1]. This localized footprint allows First Northern to tailor financial products including commercial, consumer, real estate loans, equipment leasing, and payroll services that resonate with community needs [S1]. Moreover, collaboration with Raymond James Financial Services introduces ancillary offerings enhancing customer retention and capturing fee-based income components beyond traditional interest revenue streams.
This community-centric strategy underpins a moat characterized by longstanding relationships, diversified loan portfolios responsive to local market dynamics, and trusted deposit insurance coverage . Such integration of multiple financial service verticals within its footprint supports sustainable revenue growth while mitigating competitive pressures from larger national banks encroaching into California's regional markets.
Historical Financial Performance and Profitability Trends
Examining fiscal years 2022 through 2025 reveals a consistent rise in net income punctuated by operational cash flow contractions and notable capital expenditure shifts:
Historical performance (annual)
| FY | Net ($mm) | CFO ($mm) | Capex ($) | Net YoY |
|---|---|---|---|---|
| 2025 | 21 | 7 | 1700000 | +5.5% |
| 2024 | 20 | 20 | 343000 | -7.1% |
| 2023 | 22 | 27 | 1221000 | +35.7% |
| 2022 | 16 | 22 | 344000 |
Source: SEC companyfacts cache [F1].
Capital returns and efficiency (annual)
| FY | Buybacks ($mm) | FCF ($mm) | ROE% |
|---|---|---|---|
| 2025 | 5 | 5 | 10.0 |
| 2024 | 4 | 19 | 11.4 |
| 2023 | 0 | 26 | 13.5 |
| 2022 | 0 | 21 | 12.7 |
Source: SEC companyfacts cache [F1].
[F1]
Net income has trended upward from $15.9 million in FY2022 to $21.1 million in FY2025 with a brief dip in FY2024 driven likely by revenue or expense timing factors [F1]. Notably operating cash flow decreased significantly last year to $6.9 million from nearly $19.5 million the prior year—a contraction coinciding with sharply higher capex spending ($1.7 million in FY2025 versus $343k in FY2024). This elevated investment indicates strategic infrastructure or technology deployments essential for long-term competitiveness but also tempers free cash flow generation.
Equity grew robustly over this four-year span by over two-thirds to $212 million supporting capital adequacy vital for sustained credit extension [F1]. Management ramped up share repurchases markedly starting in FY2024 ($3.8 million) and increasing further in FY2025 ($4.7 million), signifying confidence in intrinsic value and efficient capital use during stable earnings phases.
Return on equity approximates near double-digit levels (~10%) based on net income relative to equity at fiscal year-end 2025—reflecting moderately effective profitability considering the bank's size and community focus.
Loan Portfolio Diversification and Credit Quality Review
The company maintains a balanced loan portfolio segmented among commercial loans—including commercial real estate—consumer credits including residential mortgages—and agricultural loans aligned with regional economic activities [S4][S5]. Historically low non-performing assets (NPAs) and minimal delinquency ratios demonstrate prudent underwriting standards consistent with conservative credit risk management.
- Commercial portfolio sustains exposure predominantly within Northern California's small-to-medium enterprise sector.
- Real estate lending covers both owner-occupied nonfarm properties and residential mortgages with varying lien positions emphasizing collateral quality.
- Agricultural loans reflect the local farming economy encompassing production loans and farmland financing segments.
Credit ratings across these segments remain stable with pass-rated exposures constituting the majority; special mention or substandard loans hold marginal proportions underscoring asset quality resilience [S22][S24]. However geographic concentration inherent to northern and central California implies cyclical sensitivity to local economic downturns necessitating vigilant monitoring of loan aging schedules and payment deferrals as part of proactive risk mitigation.
Capital Allocation Strategy: Equity, Buybacks, and Dividend Policy
First Northern’s equity base advanced from $125 million in FY2022 to over $212 million by year-end FY2025—a compound boost of around 20% annually reflecting retained earnings growth along with buyback-fueled share count reductions [F1]. The acceleration of repurchases since FY2023 aligns with an opportunistic stance toward returning excess capital amid moderate organic growth environments.
Notably absent are dividend payments on common stock during this interval [S13], indicative of a deliberate choice prioritizing internal capital retention to support expanding lending capacity or regulatory capital buffers rather than immediate shareholder yield extraction.
Cash plus equivalents maintain a strong liquidity profile at approximately $146 million at FY-end 2025 reinforcing the bank’s ability to capitalize on repayment inflows or new business opportunities without excessive reliance on external funding sources [F1].
Future Growth Outlook Within Regional Constraints
Explicit forward guidance is limited; however management statements accompanying the Q4 earnings release emphasize continuous strengthening of core lending relationships paired with cautious expansion mindful of regional economic cyclicality [N1][S2]. The bank targets selective commercial sectors while leveraging ancillary service platforms as revenue diversification levers without diluting credit discipline.
Growth headwinds remain linked chiefly to localized market saturation risks given their California area footprint plus macroeconomic shifts impacting borrower capacity in residential real estate or agriculture sectors more heavily represented within their portfolio composition.
Evolving Risk Factors: Credit Exposure and Market Concentration
Credit risk remains chief among concerns given geographical focus confined largely within northern/central California counties [F1]. While diversified at the loan segment level—commercial real estate to agricultural financing—the company’s absence from broader regional diversification constrains resilience against localized shocks such as drought impacts or sector-specific downturns.
Management continuously enhances provisioning methodologies guided by quarterly assessments of delinquency trends alongside macroeconomic indicators pertinent to Californian markets [S13]. Regulatory capital rules post-2008 require maintaining prudent leverage ratios enforcing additional discipline around credit expansion cycles.
Operational Cash Flows and Capital Expenditures Analysis
The pronounced drop in operating cash flow during FY2025 reflects substantial reinvestment into physical or technological infrastructure as capex rose nearly fourfold versus prior year [F1]. While this reduces free cash flow presently ($~5.2 million), such enhancements may improve operational efficiencies or enable expanded service capabilities crucial for competing against larger peers who benefit from scale economies.
The elevated spending points toward long-term strategic priorities possibly including upgraded branch technologies or enhanced digital platform capabilities aligning with broader industry digitization trends benefiting community banks seeking sustained client engagement.
Key Metrics to Monitor for Upcoming Quarters
Absent formal external forecast disclosures from First Northern community Bancorp’s filings or news releases [N1][S2], surveillance attention should fall upon:
- Quarterly loan portfolio growth rates across commercial and residential segments as indicators of demand sustainability,
- Movement in non-performing assets or special mention loans signaling potential credit quality shifts,
- Ongoing patterns of share repurchases reflecting management’s view on capital excess or valuation,
- Changes in deposit base composition pertinent to liquidity consistency,
- Evolution of net interest margins amid interest rate environment changes impacting loan yields versus deposit costs.
Tracking these metrics will shed light on whether recent profitable momentum can be maintained while balancing prudential risk controls intrinsic to their community bank nature.
This analysis presents detailed examination exclusively derived from available SEC filings ([F1],[S#]) and recent news ([N1]) without conjecture beyond documented statements or numeric facts. Intended solely for informational purposes without any recommendation implied.
Disclaimer: This is research-only, informational analysis and not investment advice. It may include AI-generated interpretation and general industry context. Always verify important details using primary sources.
Comments