
Gladstone Investment’s Q3 Snapshot: Evolving Portfolio Amid Lower Middle Market Focus
Gladstone Investment Corporation’s latest quarter underscores its strategic balance of debt and equity investments targeting Lower Middle Market private companies.
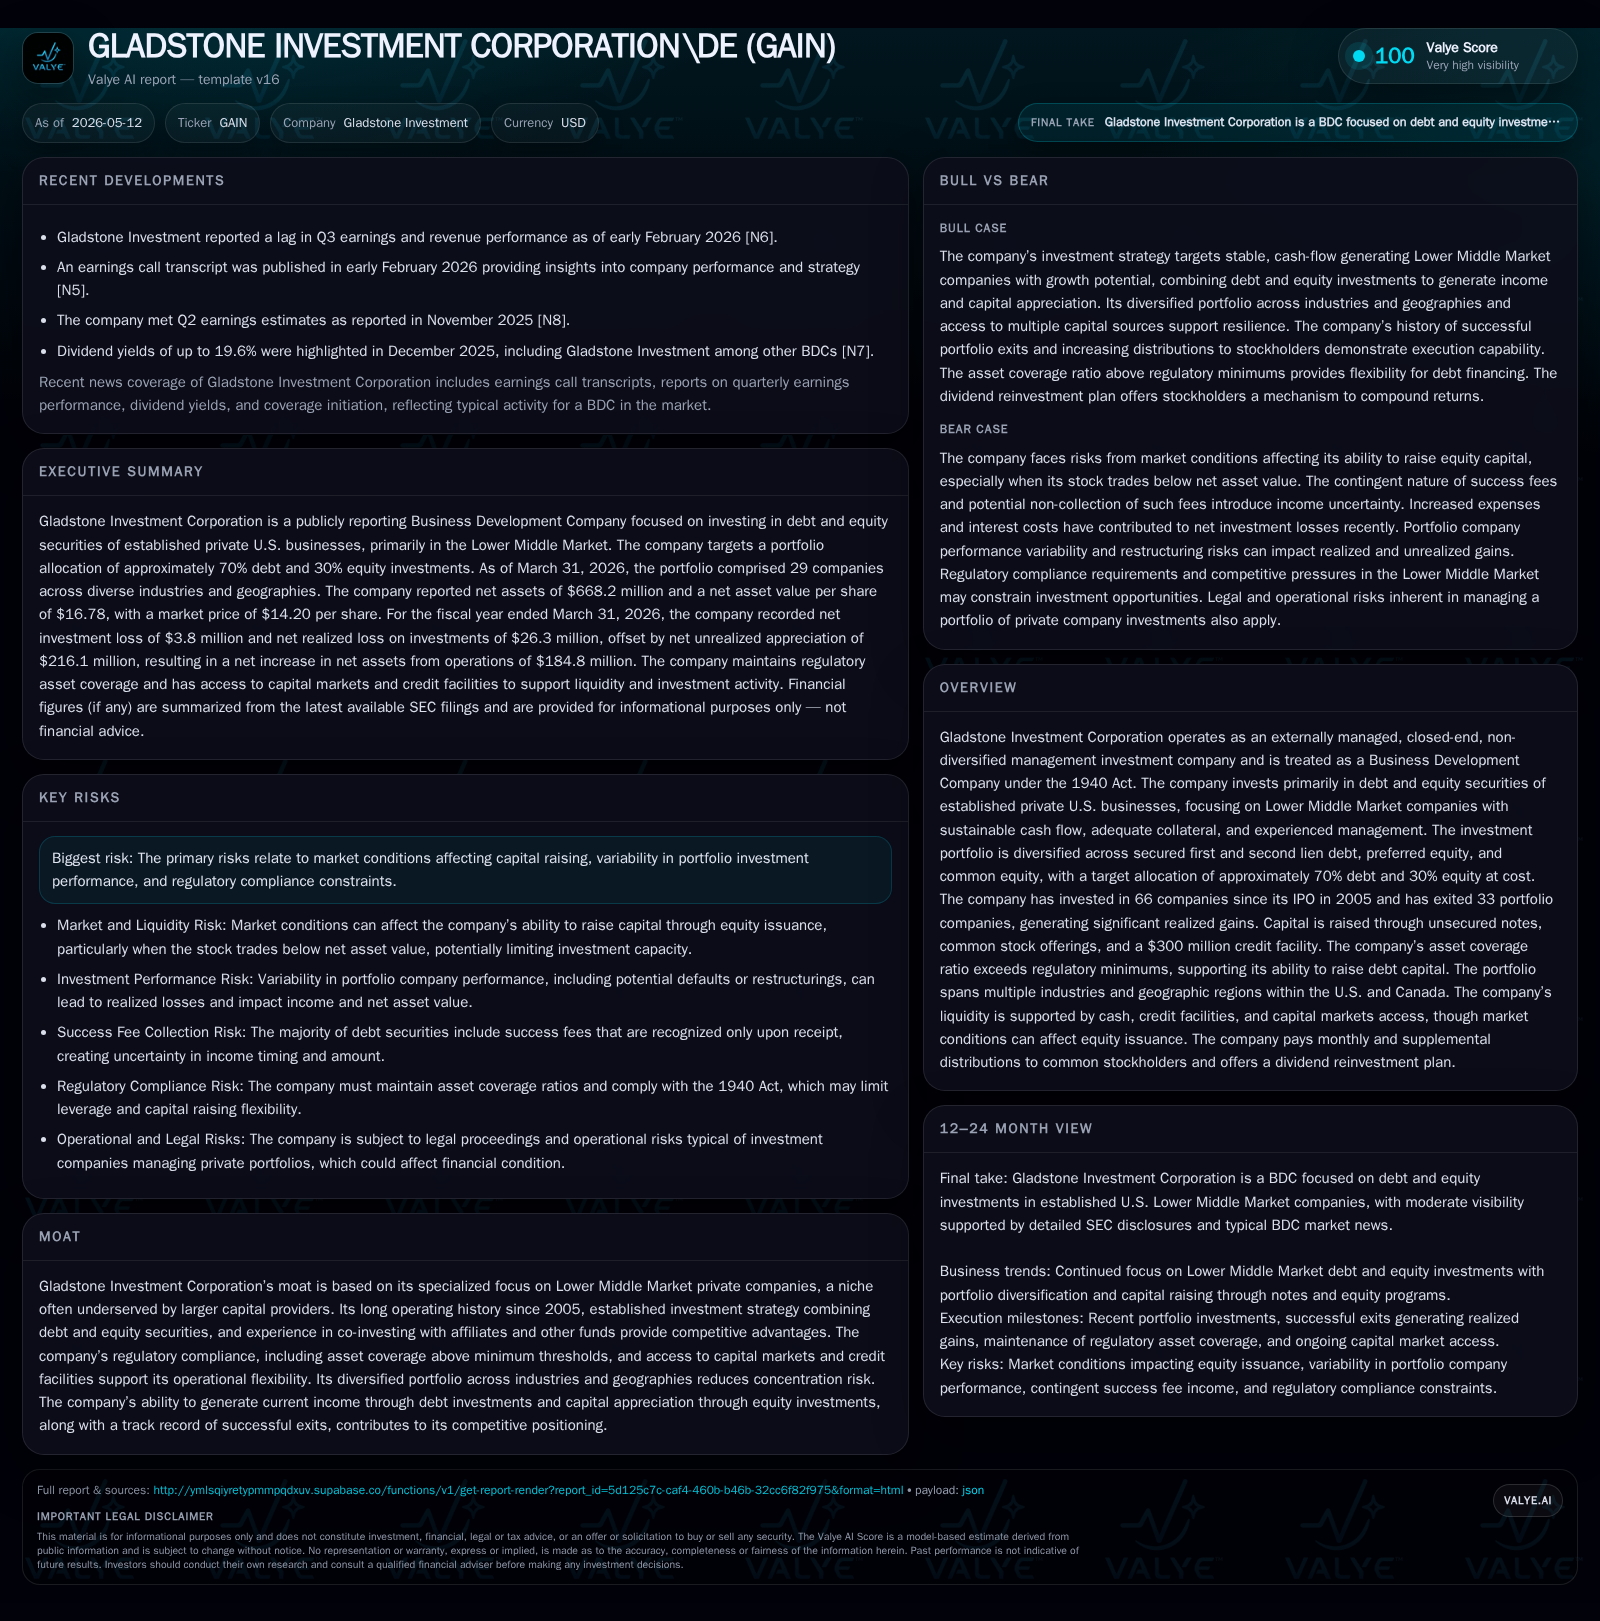
In its Q3 2026 filing, Gladstone Investment Corporation continued to manage a diversified portfolio weighted approximately 70% toward secured debt and 30% equity, focused on sustainable, cash-flow positive U.S. lower middle market companies. The firm faced reduced proceeds from sales and repayments relative to the prior year but maintained disciplined capital deployment with $174 million in new investments. It accessed capital markets through note issuances and common equity offerings while keeping strong asset coverage and regulatory compliance. Recent leadership changes and portfolio restructurings highlight ongoing active management. Key near-term focus areas include capital raising execution, portfolio turnover, and distribution consistency under regulatory constraints.
Latest Quarterly Operating Update Highlights
Gladstone Investment Corporation’s latest quarterly disclosures through the February 3, 2026 10-Q [S2] reflect a strategic navigation of capital deployment during fluctuating sales proceeds and repayments in their portfolio investment activity. Net cash used in operating activities surged to $101.6 million for fiscal year ended March 31, 2026 — starkly contrasting with net cash provided of $16.3 million for the prior fiscal year — largely attributable to diminished net proceeds from sales/recapitalizations ($33.5 million in FY2026 vs. $199.6 million in FY2025) [S1]. Despite this, Gladstone sustained material new investment purchases totaling $173.6 million, only modestly down from $221.2 million the prior year [S1], highlighting commitment to deploying capital prudently into vetted opportunities.
Concurrently, financing activities exhibited robust capital market engagement including issuance of unsecured notes aggregating approximately $157.7 million (7.125% Notes due 2031 issued for $96.9 million net proceeds; 6.875% Notes due 2028 issued for $58.8 million net proceeds) complemented by common stock offerings netting $41.6 million under their ATM program [S1][S3]. Offsetting these inflows was redemption of higher coupon debt ($74.8 million of 8% Notes due 2028) reflecting active liability management enhancing cost efficiency [S1].
Beyond transactions, operational highlights include the appointment of new leadership figures—David Dullum as CEO and John Sateri as CIO—effective shortly after quarter end [S7], pointing toward potential evolutions in portfolio management philosophy.
Gladstone Investment’s Business Model: Dual Debt and Equity Strategy
Operating as an externally managed Business Development Company (BDC) under the Investment Company Act of 1940 [S1], Gladstone Investment targets established U.S.-based Lower Middle Market companies that exhibit stable cash flow generation capabilities combined with experienced management teams and sufficient collateral profiles. Its investment strategy carefully balances approximately 70% allocation at cost toward debt instruments—primarily secured first lien loans complemented by second liens—and about 30% toward equity securities comprising preferred and common equity stakes [S23].
Investments typically conform to stringent underwriting standards encompassing loan size limits, obligor diversification mandates under credit facility covenants, industry/geographic concentration caps, as well as collateral adequacy benchmarks that collectively enhance portfolio quality [S6][S1].
Competitive Landscape in Lower Middle Market Direct Lending and Private Investments
Gladstone occupies a specialized niche within the broader private credit ecosystem by focusing on the often underserved Lower Middle Market segment where competition from large institutional lenders is less pronounced due to scale inefficiencies inherent in smaller deal sizes [S1]. Its longevity since IPO in 2005 coupled with accumulated expertise affords meaningful underwriting insight enabling differentiated risk assessment compared to newer entrants or broadly syndicated loan participants.
Externally managed BDC peers such as Carlyle Secured Lending (CGBD) [N1] demonstrate overlapping exposure but vary widely in product mix and geographic reach; Gladstone’s strategy concentrates on a diversified spread across industries yet remains anchored by credit discipline tied to business fundamentals rather than opportunistic cycles [N3]. The portfolio adheres closely to its target composition: roughly 70.8% debt (secured first lien dominating) with the remainder allocated across preferred and common equity layers [S23][S17].
Loan agreements define explicit covenants limiting exposure concentrations by single obligors or sectors alongside financial metrics monitored via lockbox arrangements administered through KeyBank ensuring prioritized collection on principal/interest remittances underpinning liquidity certainty [S6][S13]. Recent restructurings exhibit proactive credit risk management — notably a realized loss upon restructuring J.R. Hobbs Co.’s position (~$29.9 million loss transforming prior first lien loans into new tranches) balanced against conversions of distressed second lien loans into preferred equity stakes (PSI Molded Plastics example converting $10.6m of debt into preferred shares), reflecting flexibility towards protecting value while maintaining exposure continuity [S7][S10].
Sector exposures remain diversified with examples spanning perimeter security technologies (Global GRAB Technologies), oilfield chemicals (Smart Chemical Solutions), landscaping services (Sun State Nursery), filtration solutions (Rowan Energy), indicating thematic breadth aligned with durable demand drivers capable of sustaining underlying earnings streams amidst economic flux [S7][S18].
Growth Drivers: Capital Deployment Efficiency and Market Opportunities
Primary growth drivers materialize through efficient recycling of invested capital via disciplined deal selection in niche areas exhibiting limited direct competition from large monocline lenders concentrated on higher middle-market or syndicated deals [S1][S7]. The net increase in portfolio cost basis ($113M growth year-over-year) confirms trending incremental investment activity despite tides contracting exit volumes via sales or recapitalizations which declined significantly ($33M vs ~$200M prior year) constraining reinvestment liquidity [S1].
Selective equity stakes provide optionality for upside participation beyond steady-interest income associated with secured loans supporting total return enhancement potential linked directly to operational improvements or exit timing flexibility within individual portfolio companies.
Incremental originations include freshly underwritten loans such as the July ’25 secured first lien / preferred equity package into Global GRAB Technologies totaling $67.6M illustrating strategic sector plays addressing public infrastructure safety needs—a growth area benefiting from government contracts relatively insulated from commodity price cycles [S7].
Liquidity constraints challenge execution particularly as proceeds from sales/repayments sharply declined reducing free cash available for reinvestment or distributions resulting in elevated net operating cash outflows [$101M used] absent offsetting financing inflows necessitating balance sheet management optimization including timely access to public debt issuance markets or controlled ATM equity offerings constrained further when share price trades below NAV limiting attractive issuance windows due to regulatory provisions under the Investment Company Act Section 1940 restrictions on issuing stock below NAV without stockholder approval [S28][S22].
Economic cyclicality inherent within certain underlying industries such as oilfield services or commercial landscaping exposes downside vulnerability during contractionary environments impacting borrower performance metrics necessitating contingency protocols including loan restructuring discussed earlier.
Milestones Ahead: Monitoring Capital Raising, Portfolio Turnover, and Distributions
Key upcoming operational markers reside around execution efficacy related to sustaining access to external capital via unsecured notes issuance programs — monitoring pricing spreads relative to peers like Carlyle Secured Lending (CGBD) assists benchmarking attractiveness — alongside pace of ATM common stock raises which remain subscale presently versus historical norms but are critical for augmenting equity cushion necessary under asset coverage governs [N1][N3][S3].
Portfolio turnover rates will indicate directionality for reinvestment capacity needing watchfulness given substantial dropoff in repayments/sale proceeds recently reported alongside any incremental realization events potentially generating distributable gains influencing quarterly dividend declarations scheduled monthly around ~$0.08 per share class consistent with recent Board approvals reflecting targeted payout stability supporting shareholder expectations yet remaining within compliance constraints imposed by contractually defined covenants under their Credit Facility agreement [S7][S25].
Management commentary embedded within recent filings also signals continuity in external growth orientation coupled with rigorous risk-adjusted underwriting parameters reinforced by leadership changes aimed at reinforcing tactical agility.[S7]
Financial Overview: Capital Structure, Investment Activity, and Cash Flow Dynamics
Gladstone’s total debt outstanding was approximately $572.9 million as of March 31, 2026, with net debt near $568.8 million, reflecting the company’s capital structure primarily composed of publicly issued unsecured notes maturing between 2028 and 2031 bearing coupons predominantly between mid-6% to low-7% range [F1]. Cash and cash equivalents stood at about $4.1 million as of June 30, 2025 [F1].
Net cash movements underline expanded operating outflows largely tied to diminished repayment inflows contrasting increased purchase commitments necessitating offsetting financing inflows evident via successful note issuances plus controlled equity raises underpinning capital replenishment strategy sustaining balance sheet robustness requisite for continued regulated BDC operation.[S1]
Disclaimer: This analysis is based solely on public SEC filings up through May 12, 2026, company disclosures therein, and referenced news articles without speculative assumptions or forecasts beyond documented information provided herein. It is intended exclusively for informational purposes focusing on business operations rather than investment advice.
Disclaimer: This is research-only, informational analysis and not investment advice. It may include AI-generated interpretation and general industry context. Always verify important details using primary sources.
Comments