
Garmin Ltd. Builds on Multi-Segment Leadership with Vertical Integration Advantages
Garmin's diversified product portfolio and vertically integrated manufacturing underpin its sustained profitability and operational agility.
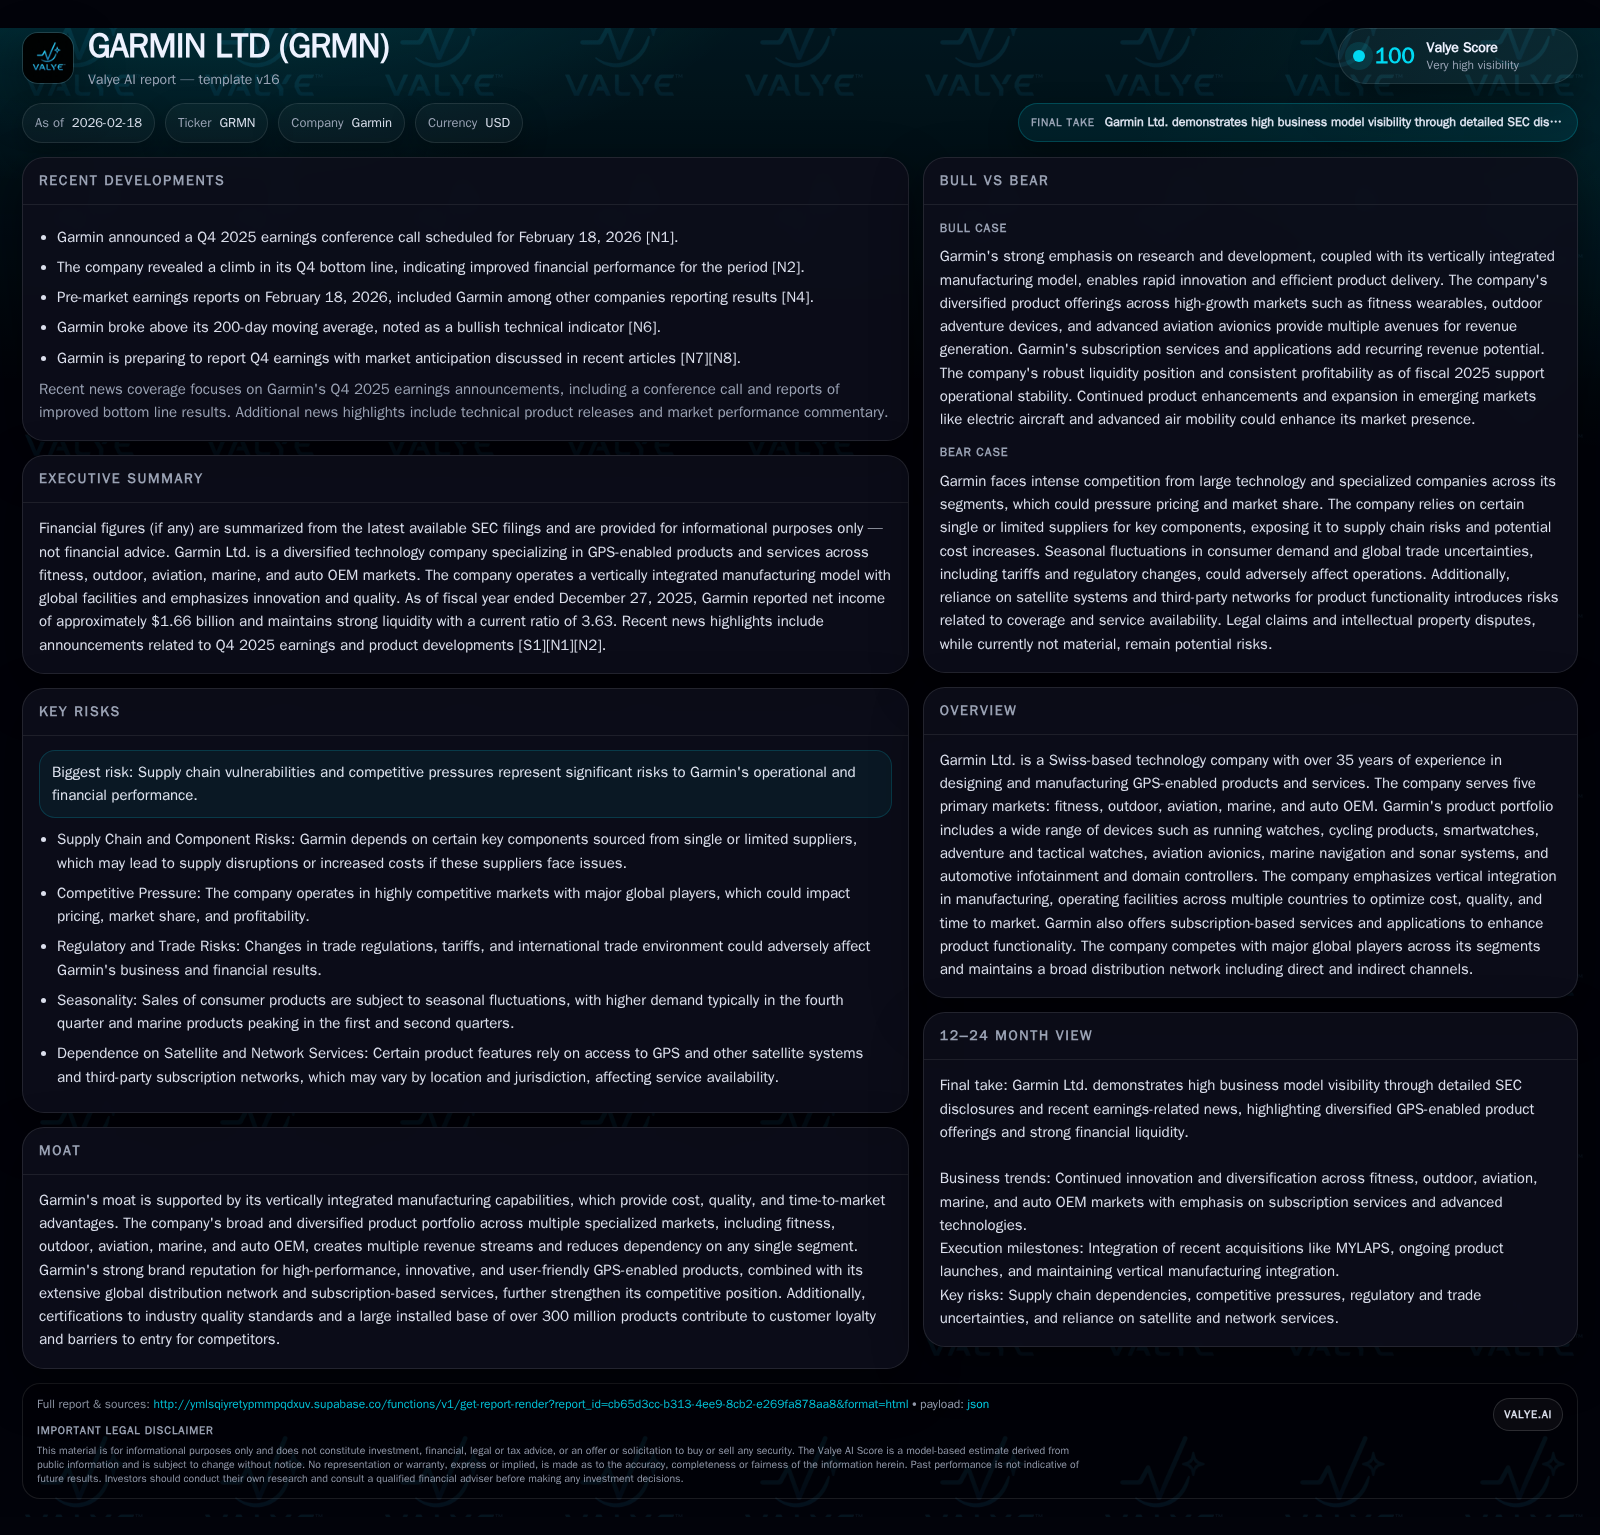
Garmin Ltd. has demonstrated robust growth driven by its multi-industry GPS-enabled products spanning fitness, outdoor, aviation, marine, and auto OEM markets. The company's vertical integration across multiple global manufacturing sites provides a durable competitive edge through superior cost control, quality assurance, and rapid time-to-market. Fiscal 2025 saw continued operating income expansion of nearly 18% year-over-year, supported by strong innovation pipelines and increased capital expenditures to fuel future product cycles. Despite facing supply chain vulnerabilities and intense competition across its segments, Garmin’s prudent capital allocation—reflected in consistent dividend payments and a high current ratio—strengthens its financial resilience. Key near-term milestones include upcoming earnings disclosures and the integration of new product offerings like the Xero L60i laser rangefinder.
Historic Growth Trajectory Anchored by Product Diversity and Vertical Integration
Garmin Ltd. continues to harness its diverse portfolio of GPS-enabled products across multiple specialized markets—fitness wearables to aviation avionics—to deliver strong profitability growth. From FY2022 through FY2025, operating income expanded consistently from approximately $1.03 billion to $1.88 billion—a compound uplift reflecting about 17.7% year-over-year growth from FY2024 to FY2025 alone [F1]. Net income followed a similar trajectory with a nearly 18% increase in the latest fiscal year. This performance underscores Garmin's success in balancing innovation with cost discipline.
The operating cash flow likewise improved substantially—to over $1.63 billion by the end of 2025—while capital expenditures increased sharply (+39.7% YoY) to just over $270 million as Garmin invests to support future growth initiatives and manufacturing enhancements [F1]. These metrics paint a picture of expanding operating leverage underpinned by multi-segment revenue sources.
Detailed Review of Garmin’s Major Market Segments and Competitive Positioning
Garmin operates across five main markets: fitness, outdoor recreation, aviation avionics, marine electronics, and automotive original equipment manufacturer (OEM) solutions [S1][S16]. Each sector demands distinct technological depth: fitness devices incorporate wrist-based biometric sensors integrated with GPS for tracking endurance sports; aviation customers require certified integrated flight decks; marine segment clients benefit from sonar-enabled chartplotters; auto OEMs look to Garmin for domain controllers powering infotainment and ADAS features.
The competitive landscape is fragmented yet intense. In fitness wearables, Garmin competes head-to-head with Apple (smartwatches) and niche brands like Coros or Suunto that emphasize rugged outdoor features [S4]. Aviation rivals include Honeywell Aerospace and Collins Aerospace offering avionics suites for commercial jets alongside Garmin’s general aviation dominance. Marine products contend against Furuno and Raymarine under Teledyne’s umbrella. The auto OEM segment faces competition from global Tier-1 suppliers such as Bosch and Harman (Samsung). Garmin leverages brand strength in reliability alongside superior time-to-market enabled by vertical integration.
Innovation Pipeline and Future Growth Drivers Supported by R&D Investments
At the nexus of product innovation is Garmin’s close-knit synergy between design engineering teams and its internal manufacturing engineers—a cornerstone allowing seamless transition from prototype to mass production under controlled costs [S4]. This model accelerates iterations on hardware-software integration critical for differentiated features such as solar-charging smartwatches or embedded satellite communication capabilities.
A recent example is the introduction of the Xero L60i laser rangefinder announced in January 2026 featuring state-of-the-art optics combined with onboard GPS mapping technology enhancing precision aiming applications [N14]. Subscriptions augment these devices’ appeal via feature updates delivered through Garmin Connect+ services. Such integrated offerings strengthen customer retention while diversifying revenue beyond initial hardware sales.
Operational Efficiency Enabled by Manufacturing Control and Supply Chain Resilience
Garmin's vertically integrated manufacturing spans multiple geographies: Taiwan hosts significant assembly lines; additional centers operate in the US (Kansas/Oregon), Netherlands, UK, Poland, and China providing scale diversification [S12]. This ownership enables tight control over production processes adhering to strict quality standards including ISO 9001 globally, IATF16949 certification in automotive plants emphasizing defect minimization for safety-critical components, plus AS9100 compliance in aviation divisions ensuring aerospace-grade reliability.
The company’s multifaceted supplier base mitigates some supply chain risks; however certain critical materials sourced from single suppliers create points of vulnerability—typical within high complexity electronics sectors [S12]. Nevertheless Garmin’s multi-segment purchasing power allows negotiation leverage potentially unavailable to smaller competitors. Safety stock policies complement these strategies against component shortages which could otherwise disrupt output availability.
Capital Allocation: Dividends, Buybacks, and Balance Sheet Strength
Garmin maintains a conservative but shareholder-friendly capital allocation approach balanced between reinvestment in operations and returning cash via dividends. The company has progressively increased dividends aligned with earnings improvements: approximately $663 million paid out in FY2025 up from $572 million the prior year represents healthy payout discipline relative to net income around $1.66 billion (~40%) [F1][S29].
Since fiscal year 2019 there have been no substantial share repurchases indicating a decision to prioritize liquidity retention or reinvestment rather than aggressive buyback programs amid market uncertainties or growth plans [F1][S26]. Garmin ended FY2025 with strong liquidity metrics including a current ratio above 3.6 reflecting solid short-term asset coverage for liabilities [F1]. Return on equity stands at roughly 18.5%, a metric consistent with efficient use of shareholder capital given Garmin’s stable margin structure.
Risks Related to Supply Chains, Legal Proceedings, and Market Competition
Garmin openly acknowledges supply chain risk factors encompassing dependency on single-source suppliers especially for memory chips or specialized RF components integral to GNSS receivers [S12]. Geopolitical tensions affecting cross-border trade—such as tariffs or export restrictions—pose potential operational disruptions amplified by global manufacturing footprints spanning Taiwan and China among others [S13].
Legal proceedings mainly involve patent disputes common in technology sectors; however management assesses ongoing claims as unlikely to materially impact financial results based on recent settlements [S5]. Market competition remains fierce with new entrants leveraging software-centric models or adjacent technologies like cellular positioning posing medium-term pressure risks especially in consumer fitness domains where rapid innovation cycles prevail [S4].
Fiscal 2025 Results: Financial Metrics Highlighting Profitability Gains
Historical performance (annual)
| FY | Net ($mm) | CFO ($mm) | OpInc ($mm) | Capex ($mm) | Net YoY |
|---|---|---|---|---|---|
| 2025 | 1664 | 1633 | 1876 | 270 | +17.9% |
| 2024 | 1411 | 1432 | 1594 | 194 | +9.4% |
| 2023 | 1290 | 1376 | 1092 | 194 | +32.5% |
| 2022 | 974 | 788 | 1028 | 244 |
Note: Omitted columns lack sufficient annual XBRL coverage in the provided tags (need ≥2 annual points): Rev, Buybacks. Source: SEC companyfacts cache [F1].
Capital returns and efficiency (annual)
| FY | Div ($mm) | FCF ($mm) | ROE% |
|---|---|---|---|
| 2025 | 664 | 1363 | 18.5 |
| 2024 | 572 | 1239 | 18.0 |
| 2023 | 559 | 1183 | 18.4 |
| 2022 | 679 | 544 | 15.7 |
Source: SEC companyfacts cache [F1].
Note: Revenue data not provided; buyback data omitted due to insufficient recent activity.
This tabular view highlights tangible operating leverage as income streams accelerate faster than historical trends while capex growth points to tactical expansion efforts likely supporting new product introductions or capacity enhancements vital for sustaining long-term growth.
What Investors Should Monitor Next: Earnings, Product Launches, and Market Trends
Key upcoming events that will shed light on Garmin’s trajectory include quarterly earnings conference calls such as the one scheduled for February 18th, where updated guidance details on sales dynamics across segments may be disclosed along with margin outlooks reflecting supply chain conditions or raw material cost movements [N1][N3][N6].
Technological announcements exemplified recently by the Xero L60i launch spotlight Garmin’s commitment towards enrichening device ecosystems with cutting-edge positional accuracy fused directly into traditional optics—a promising avenue for expanding addressable market segments especially among outdoor enthusiasts wielding sophisticated tools [N14].
Finally, monitoring macro-consumer demand signals influencing seasonal buying patterns such as holiday fitness device purchases or boating season trends can offer directional insights into short-term revenue volatility given typical fourth quarter peaks documented historically by Garmin [S12][S18]. Competitive responses especially from conglomerates entering wearable tech spaces also bear watching as they could recalibrate pricing power or feature differentiation incentives.
This analysis presents factual observations strictly grounded in disclosed financial statements ([F1]), SEC filings ([S#]), and public news releases ([N#]) without making any investment recommendations or forecasts beyond stated company disclosures.
Disclaimer: This is research-only, informational analysis and not investment advice. It may include AI-generated interpretation and general industry context. Always verify important details using primary sources.
Comments