
Global Ship Lease's Financial Surge Reflects Resilience in Containership Leasing
Global Ship Lease’s 2025 financial performance highlights top-line growth and strong net income amid strategic debt management and increasing regulatory costs.
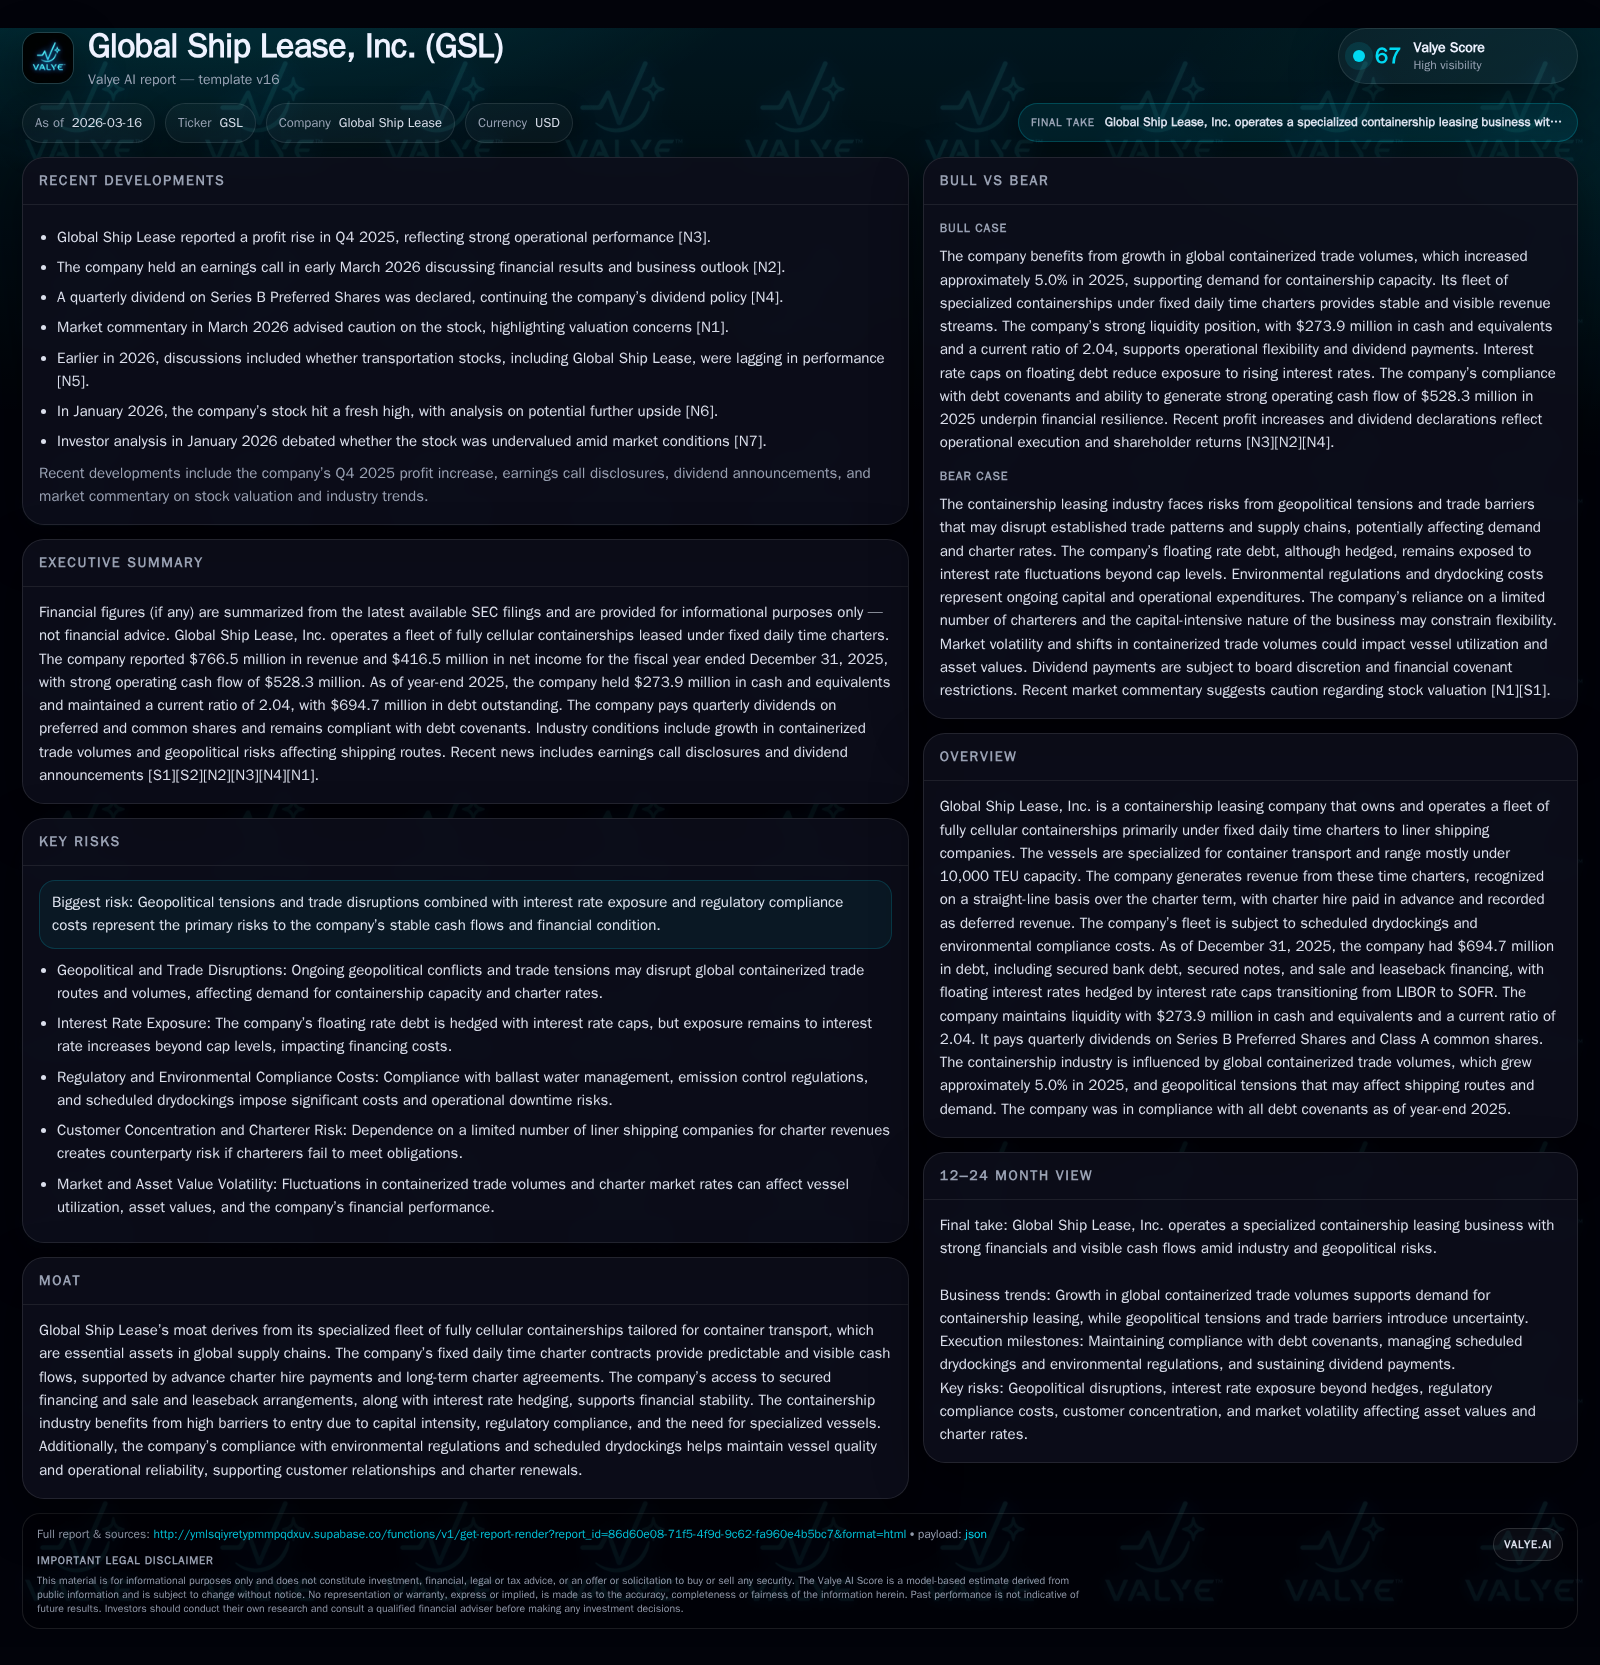
In 2025, Global Ship Lease, Inc. achieved revenue growth of 7.8%, reaching $766 million, supported by stable fixed daily time charters and consistent fleet utilization. Operating income rose 14.8%, reflecting operating leverage despite scheduled drydockings and environmental compliance expenses. The company’s $695 million debt is structured with refinanced facilities transitioning from LIBOR to SOFR, leveraging interest rate caps to mitigate costs. Dividends on preferred shares continue steadily while common share payouts increased slightly, underscoring prudence amid evolving market risks like geopolitical tensions and regulatory pressures.
An Evolving Revenue Base: Growth Drivers Behind Fiscal 2025 Gains
Historical performance (annual)
| FY | Rev ($mm) | Net ($mm) | CFO ($mm) | OpInc ($mm) | Rev YoY | Net YoY |
|---|---|---|---|---|---|---|
| 2025 | 766 | 416 | 528 | 435 | +7.8% | +17.8% |
| 2024 | 711 | 354 | 430 | 379 | +5.4% | +16.1% |
| 2023 | 675 | 305 | 375 | 343 | +4.5% | +4.0% |
| 2022 | 646 | 293 | 352 | 354 |
Source: SEC companyfacts cache [F1].
Capital returns and efficiency (annual)
| FY | ROE% |
|---|---|
| 2025 | 23.1 |
| 2024 | 24.2 |
| 2023 | 25.7 |
| 2022 | 30.3 |
Source: SEC companyfacts cache [F1].
Global Ship Lease (GSL) posted a commendable revenue increase in fiscal 2025, generating $766.5 million—up 7.8% from $711.1 million in the prior year [F1]. This growth was underpinned primarily by the company's fixed daily time charters for its specialized fully cellular containership fleet, which ensures predictable revenues mostly denominated in U.S. dollars [S1]. Stability in charter agreements combined with consistent fleet utilization supported this uplift while incremental proceeds from selective vessel sales contributed positive cash inflows [N3][S17]. The fleet composition—dominated by vessels under 10,000 TEU capacity—is tailored to container shipping’s evolving demand patterns, balancing operational agility with market needs.
Operating Income and Margin Dynamics Through Market Fluctuations
Operating income climbed sharply to $435.1 million in 2025 from $379.1 million the prior year, a substantial 14.8% increase [F1]. This outpaced revenue growth due to operational leverage wherein fixed daily charter contract terms provided margin protection despite elevated scheduled drydocking expenditures averaging $3.4 million each [S20]. However, rising environmental compliance expenses and periodic off-hire losses during these maintenance windows prudently limit wider margin expansion [S10]. The consistent recognition of charter hire on a straight-line basis furthers earnings visibility in an otherwise capital-asset intensive sector [S22].
Cash Flow Strength and Capital Expenditures: Fueling Sustainable Operations
GSL’s operating cash flow surged by 22.8% year-over-year to $528.3 million for 2025 [F1], outstripping net income gains—a positive signal of earnings quality supported by non-cash charges such as depreciation ($122 million) [F1] and timing effects from operating working capital shifts [S14]. Capital expenditures—approximately $121.5 million spent mainly on drydocking activities, ballast water management compliance, and incremental vessel acquisitions or upgrades—are pivotal in maintaining fleet competitiveness while meeting regulatory mandates [S20][S22]. Resultant free cash flow stands robust at approximately $516.9 million after these investments [F1], providing flexibility for deleveraging or shareholder returns.
Debt Profile Refined: Transitioning from LIBOR to SOFR Amid Refinancing
At end-2025, GSL maintained total indebtedness of $694.7 million comprising secured bank loans ($311 million), investment-grade rated senior notes ($179.4 million), and sale and leaseback financing ($204.3 million) [F1][S5]. The capital structure reflects active management evidenced by prepayments on older credit lines including full repayment of HCOB-CACIB Credit Facility in early 2025 financed partly via an $85 million UBS credit facility drawn down during Q2 2025 [S4][S6].
Interest rates shifted predominantly from LIBOR to SOFR benchmarks following regulatory phase outs mid-2023, with floating rate debt protected by USD one-month interest rate caps set around 0.75% (transitioned effectively to compounded SOFR at ~0.64%) covering approximately 75% of floating-rate obligations [S12][S16][S18]. Margins range from ~1.85% to ~2.85% above SOFR depending on tranche type [S4]. Sale-leaseback repayments follow protracted quarterly amortizations extending into the mid-2030s underpinning medium-term liquidity stability [S19][S29].
Robust loan covenants impose requirements including a minimum group liquidity of $20 million and vessel collateral-to-debt value ratios between 125%-135%, with the company compliant as of December 31, 2025 [S7][S9].
Dividend Policy Enacted with Prudence Amid Charter Market Signals
Quarterly dividends on the Company’s Series B Cumulative Redeemable Perpetual Preferred Shares remain stable at approximately $2.4 million per quarter, reflecting contractual commitments based on outstanding shares as of year-end [N4][S2][S16]. Meanwhile, common share dividends saw increments during the latter half of 2025—from $0.525 per share initially to $0.625 per share late in the year—with continuation anticipated into early 2026 contingent on board approval and adherence to covenant restrictions [N4][S16].
Dividend sustainability benefits from ample free cash flow generation balanced against sizeable debt amortization schedules coming due over next two years totaling over $390 million cumulatively, signaling careful capital allocation decisions ahead [S20]. Share repurchase authorizations remain available though sparingly executed given current leverage levels.
Environmental Compliance and Drydocking: Operational Cost Considerations
Compliance with maritime environmental regulations remains a significant recurring operating cost element for GSL’s fleet operations [S10][S20]. Mandatory drydockings are scheduled systematically across vessels every few years entailing average costs near $3.4 million each plus off-hire days causing temporary revenue gaps [S20]. In addition to drydockings, expenditures accrue from ballast water management system installations mandated internationally alongside potential retrofitting of exhaust gas scrubbers aimed at reducing sulfur oxide emissions aligned with emerging IMO standards.
These outlays represent necessary investments preserving asset value, regulatory certification status from classification societies, charterer confidence, and operational reliability essential for renewal negotiation leverage [S10][S22]. While potentially constraining near-term margins, such proactive steps mitigate risks of non-compliance penalties or costly unscheduled downtime.
Strategic Outlook: Growth Prospects Versus Geopolitical and Regulatory Constraints
Looking ahead, GSL faces dual forces shaping its growth vector: ongoing demand recovery fostering containership charter renewals vis-à-vis persistent global trade uncertainties stemming from geopolitical frictions notably U.S.-China tensions, Russia-Ukraine conflict spillovers and Middle East conflicts which may disrupt supply chains or shift trade patterns abruptly impacting charter coverage visibility [N1][N2][S24][S25].
The containership orderbook-to-fleet ratio declined modestly to about one-third capacity signaling moderate newbuilding activity aiding supply-demand balance; however elevated cost inflation for new tonnage plus tightened financing conditions may cap fleet expansion pace indirectly benefitting existing owners like GSL who maintain modernized mid-sized fleets focusing on eco-efficient designs capable of accessing varied ports globally [S24][S25].
Environmental regulation implementation continues tightening which could elevate compliance capital needs but also raise barriers for newer entrants or less adaptable competitors strengthening GSL’s moat built on compliant assets subjected regularly to inspection regimes ensuring classification status integrity.
Capital expenditure plans anticipate no materially expanded commitments beyond scheduled drydockings plus incremental expenditures related to compliance or selective acquisitions aligned with growth strategy outlined in recent filings without immediate pressure for large-scale fleet augmentations [S20][N3].
Investor Watchpoints: Milestones, Risks, and Market Sentiment
Key metrics for close investor attention include the execution progress against significant debt amortization tranches due in the near term ($147.6 million in secured term loans maturing in 2026), effectiveness of interest rate caps amid fluctuating SOFR levels affecting borrowing cost volatility exposure; ongoing dividend payment consistency especially regarding common shares amid evolving liquidity dynamics; layers of covenant protections particularly minimum liquidity buffers & collateral valuations; plus rationales behind limited share repurchases given remaining ~$33 million authorized capacity as noted through recent disclosures [F1][N2][S7][N3].
Market participants have spotlighted caution around geopolitical uncertainties potentially impairing global containerized trade volumes thereby affecting vessel utilization risk profiles along with regulatory cost escalation possibly compressing margins if passing through charters is constrained or vessel off-hire incidents rise unexpectedly [N2]. Despite this backdrop, the company’s resilient revenue growth trajectory coupled with prudent financial engineering centered around refinancing activities transitioning legacy LIBOR exposures towards SOFR framework offers some confidence in managing interest expense trajectories moving forward.
This analysis is based solely on publicly disclosed financial data up to March 16th, 2026 including Global Ship Lease’s Annual Report (Form 20-F), recent news reports, and related regulatory filings referenced herein. It provides an examination of historical performance trends together with reported strategic intentions without recommending any investment action.
Disclaimer: This is research-only, informational analysis and not investment advice. It may include AI-generated interpretation and general industry context. Always verify important details using primary sources.
Comments