
Pharma-Bio Serv Battles Revenue Decline with Strategic Operating Adjustments and Geographic Diversification
Specialized regulatory consulting firm shows resilience amid shrinking revenues by leveraging multi-region presence and cost controls.
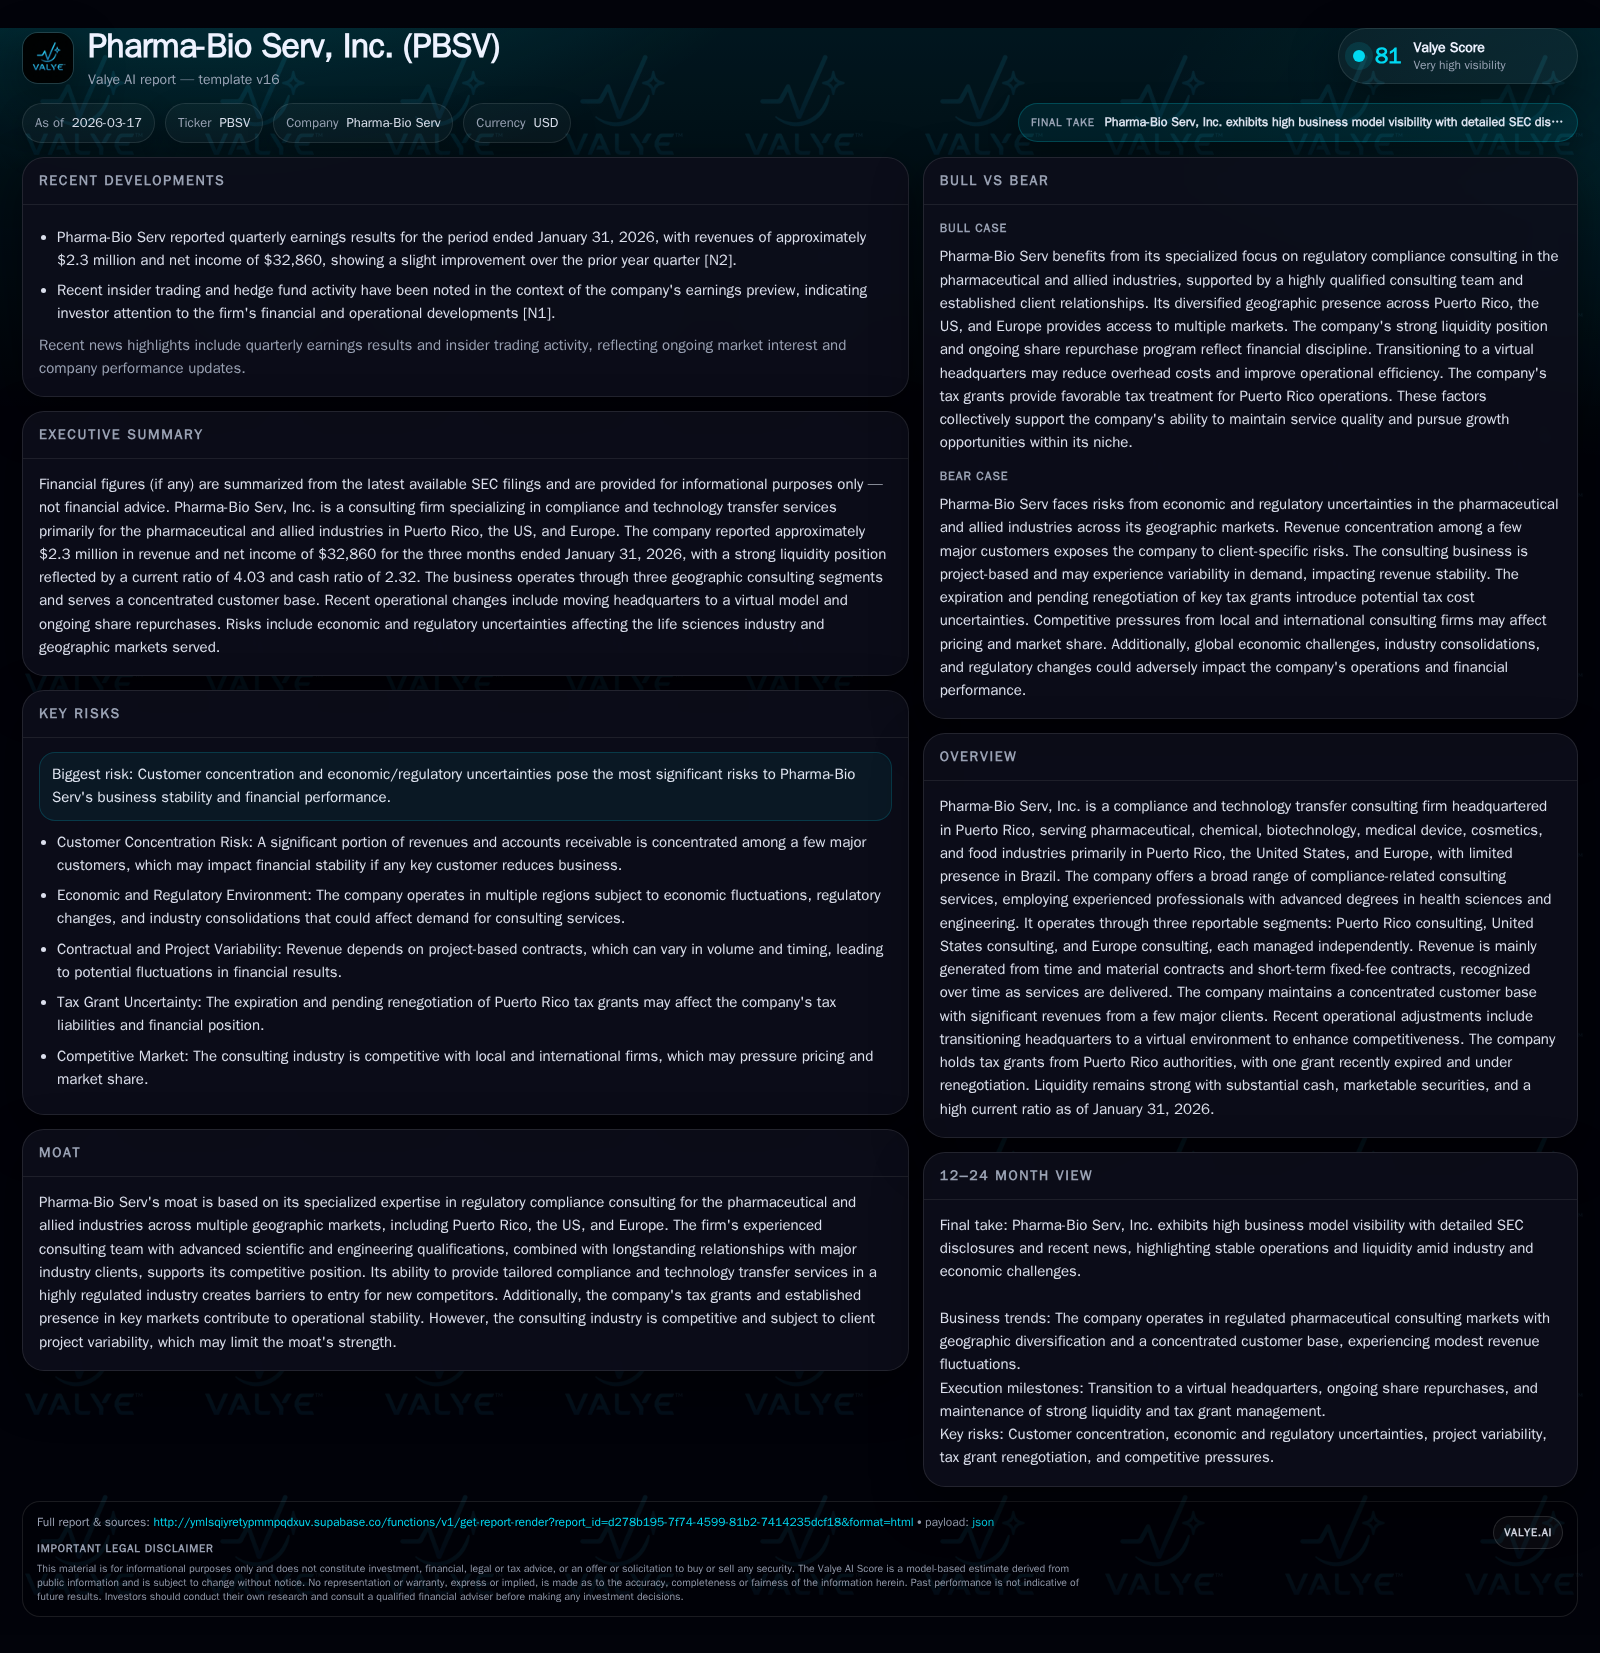
Pharma-Bio Serv, Inc. experienced a revenue decline over recent years but has implemented structural adjustments including virtualizing its headquarters to reduce costs. Fiscal 2025 revenue declined 5.3% year-over-year to $9 million from nearly $9.5 million, driven by softer demand in U.S. and European consulting segments while Puerto Rico remained stable. Operating losses narrowed significantly from prior years, though operating cash flow remains negative. The company maintains a concentrated client base across pharmaceutical-related industries in Puerto Rico, the U.S., and Europe, focusing on margin sustainability through operational efficiencies and geographic diversification.
Overview
Pharma-Bio Serv, Inc. specializes in regulatory compliance consulting for life sciences sectors such as pharmaceuticals, biotechnology, chemical, medical devices, cosmetics, and food industries. Headquartered in Puerto Rico with operations spanning the United States, Europe, and minor presence elsewhere, it delivers tailored consulting services primarily based on time and materials contracts (99%), supplemented by short-term fixed-fee agreements (1%) with revenue recognized over time as milestones are reached [S15], [S23], [S19].
Historical Performance and Growth Drivers
The company's revenue peaked near $19.4 million in fiscal year 2022 before declining sharply to approximately $9 million by FY2025—a drop of over 50% across three years—largely due to reduced project activity in U.S. and European consulting segments while the Puerto Rico segment remained more stable [F1], [S10], [S25].
Historical performance (annual)
| FY | Rev ($mm) | Net ($) | CFO ($) | OpInc ($) | Rev YoY | Net YoY |
|---|---|---|---|---|---|---|
| 2025 | 9 | -100463 | -214886 | -637662 | -5.3% | +87.1% |
| 2024 | 10 | -777619 | -566701 | -1287587 | -44.0% | -159.4% |
| 2023 | 17 | 1310180 | 1890960 | 1117411 | -12.5% | +30.1% |
| 2022 | 19 | 1006684 | 592457 | 1174945 |
Source: SEC companyfacts cache [F1].
Capital returns and efficiency (annual)
| FY | Div ($mm) | Buybacks ($) | FCF ($) |
|---|---|---|---|
| 2025 | 2 | 31443 | -221530 |
| 2024 | 2 | 11263 | -726444 |
| 2023 | 2 | 34344 | 1883709 |
| 2022 | 3 | 81992 | 573188 |
Source: SEC companyfacts cache [F1].
The improvement in operating income from FY2024 to FY2025 reflects effective cost containment despite ongoing top-line pressures. Operating cash flow turned less negative but remained below zero due to the sustained net losses and working capital dynamics.
Segment Dynamics and Geographic Footprint
Operations are organized into three reportable segments: Puerto Rico consulting; United States consulting; and Europe consulting. These segments serve regulated industries primarily through project-based engagements assessed by revenue volume and gross profit margins [S8], [S25].
For the three-month period ended January 31, 2026 (Q1), revenues were approximately split as follows: Puerto Rico accounted for about half (50.7%), Europe for roughly a quarter (25.5%), and the U.S. for just under a quarter (23.8%) of total revenues [$2.3 million] [S9]. Both the European and U.S. segments experienced declines relative to prior periods while Puerto Rico was broadly stable.
Customer concentration remains significant with four major clients collectively representing around 45-50% of revenues recently across these geographies. This concentration highlights dependency risks inherent in their project-driven business model where contract volumes fluctuate based on client needs and industry trends [S6], [S25], [S26].
Operational Changes and Cost Controls
In response to evolving market conditions and cost pressures the company allowed its headquarters office lease to expire December 31, 2025 and shifted administrative functions to a virtual office setup aimed at reducing fixed overhead while maintaining service levels and agility [S10].
Puerto Rico tax incentives supporting the business have changed recently: a long-standing grant covering activities until October 31, 2024 expired; management is actively negotiating renewal under local Acts without expecting material disruption pending approval [S10]. These incentives have historically contributed meaningfully to overall cost competitiveness.
Financial Health and Capital Allocation
Liquidity remains strong with working capital near $13.3 million against current liabilities of approximately $3.3 million as of January 31, 2026 yielding a current ratio above four times—indicative of robust short-term financial flexibility [F1], [S12]. Cash equivalents include deposits insured by FDIC alongside short-term U.S. Treasury securities with no impairment recorded.
Capital expenditures have dropped substantially to about $6.6K in FY2025 from prior years’ levels reflecting limited investment needs or strategic restraint during revenue contraction phases [F1]. Operating cash flow remains negative but improved compared to previous fiscal periods.
The company sustains an active share repurchase program authorized since June 2014 allowing up to two million shares to be repurchased at management’s discretion; approximately half a million shares had been repurchased cumulatively by early 2026 at low average prices reflecting depressed market valuations relative to book value per share [F1], [S18]. Dividend policy remains consistent with quarterly payouts near $0.075 per common share totaling around $1.7 million annually despite muted profitability.
Outlook and Considerations
Future growth prospects depend on revitalizing demand particularly within U.S. and European markets that have shown softness recently amid broader macroeconomic uncertainties including industry consolidations and pandemic-related operational challenges [S9]. The company’s niche regulatory expertise combined with established global client relationships provides competitive barriers albeit within a competitive consultancy landscape.
Risks include high client concentration which may introduce volatility if any major customer reduces outsourcing spend abruptly or consolidates supplier bases further. Additional uncertainties stem from global economic conditions including inflationary pressures and potential changes in tax regulations affecting Puerto Rican operations.
Management’s ongoing marketing efforts aim to diversify project pipelines geographically while embracing technological platforms supporting remote consulting capabilities aligned with recent virtualization strategies.
Historical Financial Summary Table
| Metric | FY2022 | FY2023 | FY2024 | FY2025 |
|---|---|---|---|---|
| Revenue (USD) | $19.4M | $17.0M | $9.51M | $9.00M |
| Operating Income (USD) | $1.17M | $1.12M | $(1.29M) | $(0.64M) |
| Net Income (USD) | $1.01M | $1.31M | $(0.78M) | $(0.10M) |
| Operating Cash Flow | $592K | $1.89M | $(567K) | $(215K) |
| Capital Expenditures | $19K | $7K | $160K | $7K |
| Dividends Paid | $3.45M | $1.72M | $1.72M | $1.72M |
| Share Buybacks | $82K | $34K | $11K | $31K |
Disclaimer: This analysis is based solely on publicly available financial filings as of March 17, 2026 and does not constitute investment advice.
Disclaimer: This is research-only, informational analysis and not investment advice. It may include AI-generated interpretation and general industry context. Always verify important details using primary sources.
Comments