
Best Buy’s Resilient Sales and Strategic Shifts Drive Earnings Growth in Fiscal 2026
Best Buy's fiscal 2026 results reflect modest revenue gains alongside significant operating income expansion driven by omnichannel integration and cost efficiencies.
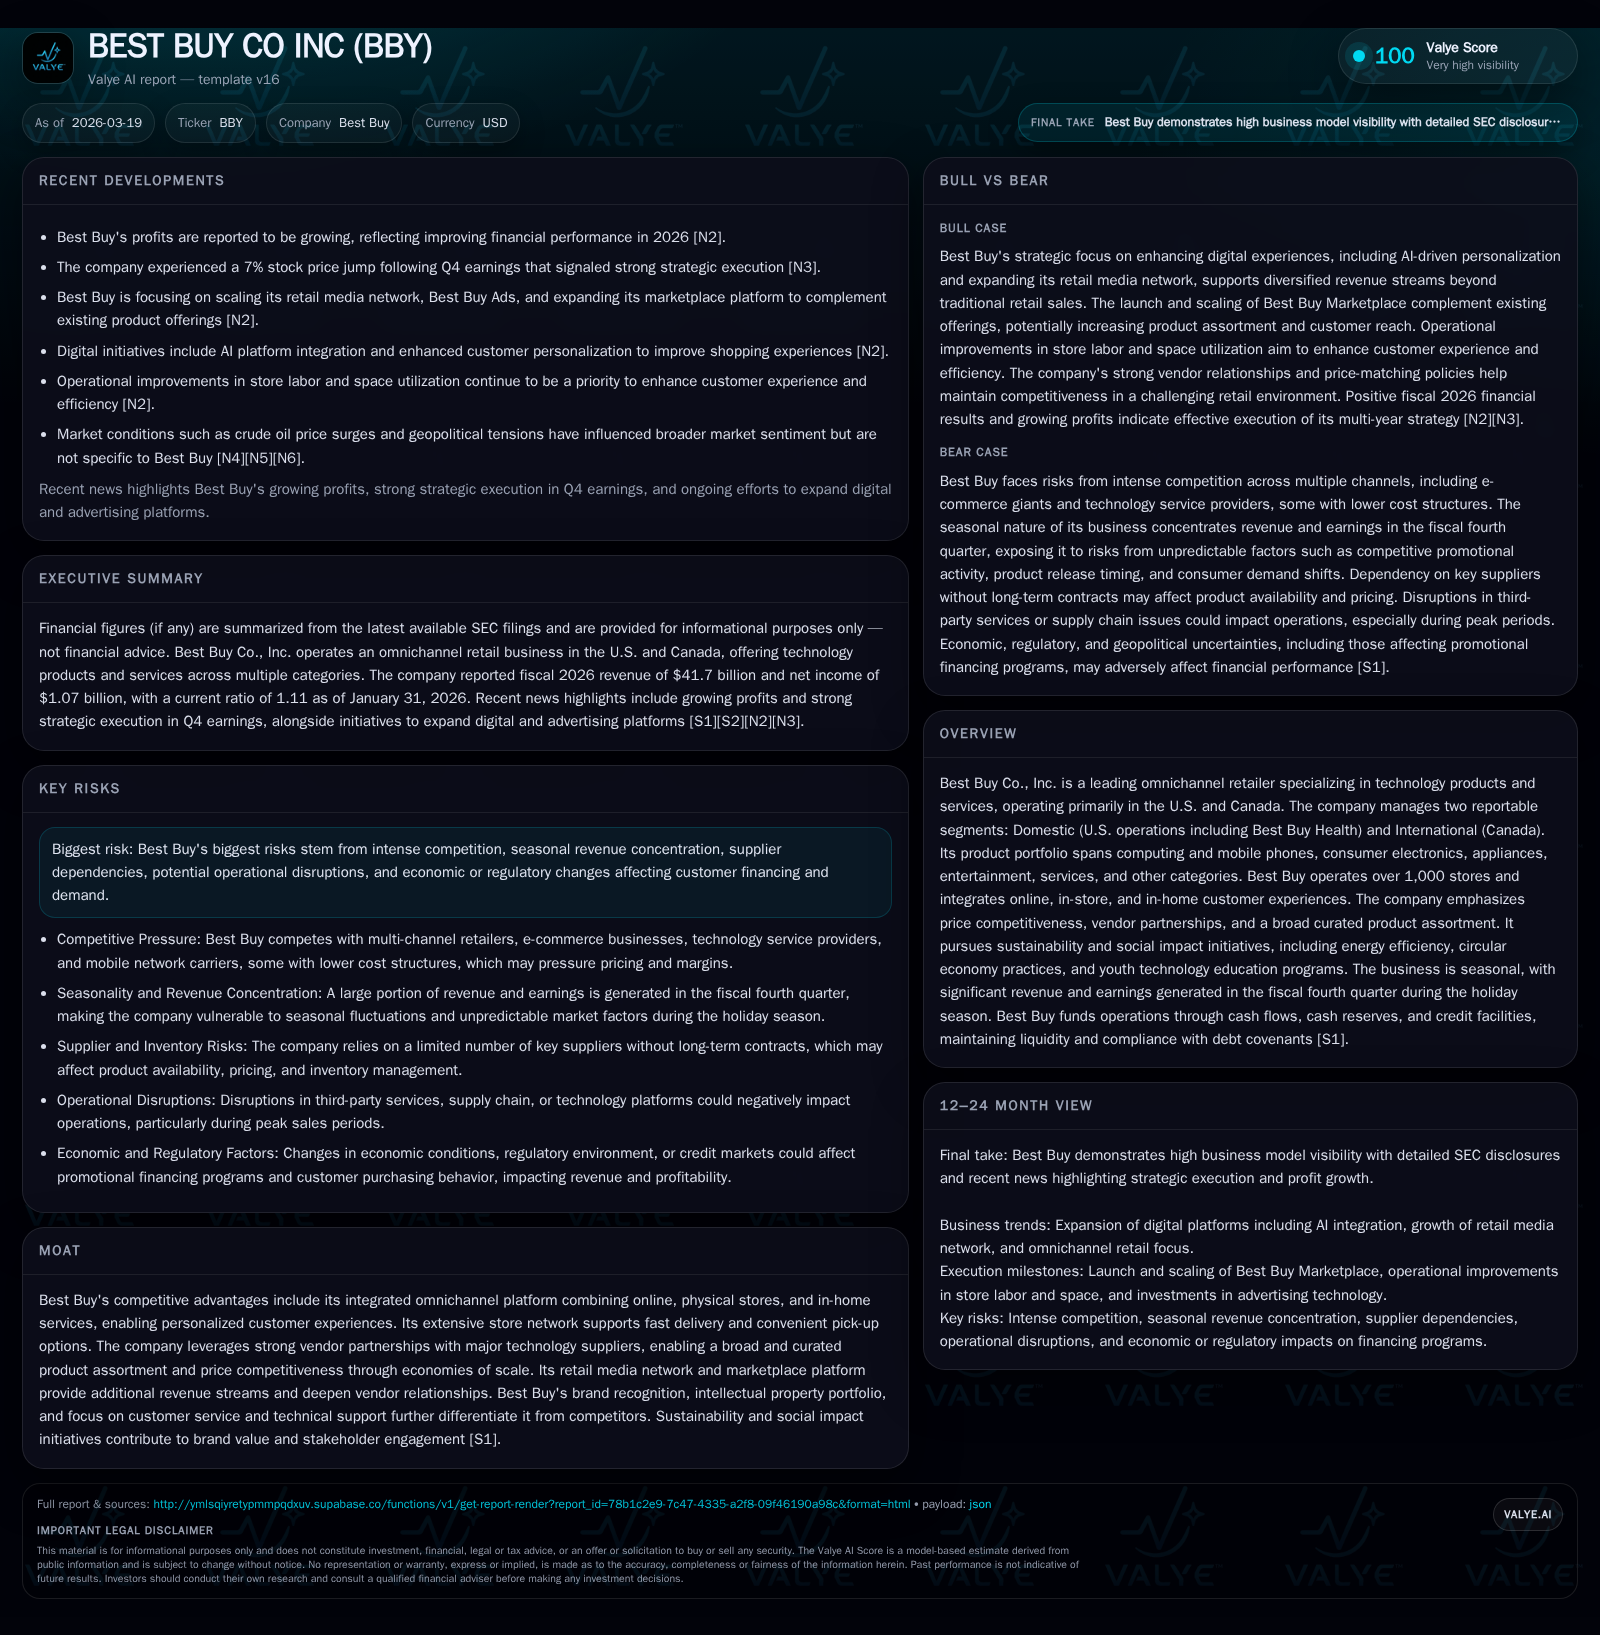
In fiscal 2026, Best Buy returned to year-over-year revenue growth with a 0.4% increase to $41.7 billion, halting prior declines, while operating income rose by over 10% to $1.39 billion, supported by efficiency programs and strategic vendor collaborations [F1]. The company’s integrated omnichannel model combining stores, digital platforms, and in-home services continues to differentiate its customer engagement and enable marketplace advertising revenue growth [S1]. Despite challenges like supply chain uncertainties, macroeconomic headwinds, and competitive pressure on pricing, Best Buy maintained robust cash flows and consistent dividend payouts, adjusting share repurchases downward [F1][S11]. Looking ahead, monitoring the impact of inflationary cost pressures and expansion of retail media networks will be key for sustaining momentum [N2][S15].
Fiscal 2026 Performance: Modest Top-Line Growth, Strong Margin Expansion
Best Buy’s fiscal year ended January 31, 2026 delivered a pivotal shift after years of revenue softness, posting a slight 0.4% increase to $41.7 billion compared to $41.5 billion in the prior fiscal year (F1). This marks a break from consecutive declines observed in FY23 (-8%) and FY24 (-6%) before stabilizing in FY25 (F1). Operating income rose meaningfully by 10.1% to $1.39 billion from $1.26 billion the previous year amid better cost controls and operational efficiencies (F1). Net income amplified more sharply by 15.3% to $1.07 billion as tax efficiencies and tighter expense management supported bottom-line growth (F1).
The deceleration in top-line growth relative to prior contraction conceals the underlying operational leverage obtained through targeted resource optimization programs detailed by management during the Q4 earnings call (N2), which helped improve SG&A efficiency despite inflationary pressures. Sustained investment in fulfillment capabilities also contributed to better margin retention across domestic and international segments.
Historical performance (annual)
| FY | Rev ($bn) | Net ($mm) | CFO ($bn) | OpInc ($mm) | Rev YoY | Net YoY |
|---|---|---|---|---|---|---|
| 2026 | 41.7 | 1069 | 2.0 | 1389 | +0.4% | +15.3% |
| 2025 | 41.5 | 927 | 2.1 | 1262 | -4.4% | -25.3% |
| 2024 | 43.5 | 1241 | 1.5 | 1574 | -6.1% | -12.5% |
| 2023 | 46.3 | 1419 | 1.8 | 1795 |
Source: SEC companyfacts cache [F1].
Capital returns and efficiency (annual)
| FY | Div ($mm) | Buybacks ($mm) | FCF ($mm) |
|---|---|---|---|
| 2026 | 801 | 273 | 1258 |
| 2025 | 807 | 500 | 1392 |
| 2024 | 801 | 340 | 675 |
| 2023 | 789 | 1014 | 894 |
Source: SEC companyfacts cache [F1].
Note: Revenue growth rates computed based on available data points ([F1]).
Key Drivers Behind Operating Income and Net Income Improvements
The robust earnings improvement emanated chiefly from Best Buy’s multi-faceted efficiency initiatives highlighted during earnings remarks (N2) and MD&A disclosures (S1). Programs started earlier in the fiscal year focused on labor optimization across stores and corporate ranks as well as supply chain sourcing adjustments—particularly enhanced relationships with Asian vendors—that lowered procurement costs without compromising product quality.
Pricing strategy played a critical role: despite broad inflationary pressures, Best Buy managed selective price increases on key categories such as computing devices where demand remained resilient (N1). Vendor economies of scale amplified purchasing power enabling competitive pricing that protected unit volume while partially offsetting input cost hikes.
Additionally, contribution from the company’s Domestic segment—including Best Buy Health operations—and International Canadian stores was balanced (S5, S20). Notable margin uplift came from scaling service-related revenues through Geek Squad technical support and warranty products, which carry higher profitability than hardware sales (S9).
Challenges and Market Dynamics Impacting Sales and Costs
Macroeconomic headwinds present a meaningful drag on consumer discretionary electronics purchases, more so given Best Buy’s seasonal revenue concentration in Q4 holiday periods that are difficult to forecast due to unpredictable promotional environments (S8, S15). Inflationary costs for transportation, labor wages amidst tightening labor markets, tariffs on imported components especially from China and Southeast Asia all elevated operating expenses during the period (S15).
Competitive pricing pressures from online pure-plays and expanding retail media networks complicate margin retention strategies (S18). Moreover, evolving mobile carrier consolidation impacts contract terms for device upgrades central to Best Buy’s mobile phone sales growth trajectory (S14). These dynamics underscore the company's imperative to continually innovate in price promotions while managing cost structures tightly.
Growth Opportunities Arising from Omnichannel Strength and Vendor Partnerships
Best Buy’s integrated omnichannel platform—encompassing over 1,000 physical stores across U.S. and Canada supplemented by online sales channels and in-home service offerings—remains a core competitive advantage (S1). This ‘brick-and-click’ synergy enables rapid delivery options including ship-from-store models and curbside pickup favored by consumers preferring convenience combined with expert in-person advice.
Expansion of retail media network capabilities through Best Buy Ads targets incremental vendor marketing budgets via data-driven audience engagement campaigns facilitated through proprietary digital platforms (S19). Likewise, the newly launched Best Buy Marketplace within the Domestic segment broadens product assortment without inventory risk while unlocking commission fees plus ancillary advertising revenues—an emerging profit stream affording higher margins than traditional hardware sales (S19).
These developments align with broader industry trends where retailers monetize consumer interaction data directly via retail media networks as brands deploy more targeted spend away from conventional advertising outlets.
Capital Deployment: Dividends, Share Repurchases, and Cash Flow Dynamics
Fiscal year-end figures disclose capital allocation prudence amid external uncertainties: while dividends remained stable at approximately $801 million reflecting a commitment to shareholder returns consistent with previous years ([F1], [S11]), share repurchases were curtailed significantly to $273 million versus $500 million the prior year—indicating cautious cash deployment balanced against operational investments ([F1]).
Operating cash flow declined ~6.5% year-over-year to about $2 billion driven partly by timing variations in accounts payable and inventory purchasing cycles ([F1], [S7]). Capital expenditures held virtually steady at $704 million compared to last year’s spend of $706 million focusing primarily on e-commerce technology enhancements ($463 million) alongside store remodels and supply chain projects ([F1], [S11]).
A return-on-equity estimate near 36% illustrates effective use of equity capital despite moderate revenue growth stagnation—a notable signal of margin discipline under current market conditions ([F1]).
Strategic Roadmap: What to Monitor for Future Milestones Amid Macroeconomic Risks
Explicit forward guidance is limited though key indicators surface through management commentary emphasizing priorities around AI-enabled digital retail enhancements intended to personalize shopping journeys via app platforms together with continued store labor optimizations ([N2], [S19]). These innovations could potentially birth new customer acquisition vectors vital amid increased competition.
Risk factors rooted in uncertain global trade policies—tariffs or logistics disruptions—and evolving regulatory frameworks particularly concerning data privacy laws pose ongoing constraints on commercial flexibility ([S15], [S22]). The fluid landscape of credit card financing programs also bears watching since these underpin roughly a quarter of Domestic segment revenues through branded card usage critical for incremental sales generation ([S6], [S8]).
Potential catalysts may emerge from expansion of membership subscription services offering enhanced total care packages or deeper penetration into B2B commercial channels leveraging vendor partnerships ([S19]). Tactical execution across these fronts will influence trajectory toward longer-term sustainable growth.
Competitive Differentiation in Technology Retail and Service Offerings
Best Buy’s moat rests heavily on orchestration of tech expertise combined with human touch—the hallmark Geek Squad providing trusted technical support distinguishes it clearly from online-only retailers unable to replicate personalized service experiences ([S9]).
Product assortments curated through strong ties with top vendors such as Apple, Samsung & HP underpin category leadership especially in computing/mobile phones which remain growth pillars within Domestic operations ([S5], [S20]). The My Best Buy membership program complements this strategy by enhancing customer lifetime value through loyalty incentives tied tightly into service offerings rather than mere transactional engagement.
This multi-segment approach spanning consumer electronics hardware, appliances, entertainment software/gaming products along with expanding health-related technology offerings sustains relevance amid dynamically shifting consumer preferences through innovation-led portfolio adaptations ([S9]).
Disclaimer: This report is prepared for informational purposes rooted exclusively in publicly available financial disclosures including SEC filings, company communications, and reputable financial news sources; it does not constitute investment advice or recommendations.
Disclaimer: This is research-only, informational analysis and not investment advice. It may include AI-generated interpretation and general industry context. Always verify important details using primary sources.
Comments