
Hines Global Income Trust Updates NAV Strategy and Portfolio Acquisitions in Q2 2026
Q2 2026 results highlight NAV-based liquidity pressures amid ongoing portfolio expansion and valuation governance enhancements.
Hines Global Income Trust reported a net loss for Q2 2026 despite stable revenues from its diversified commercial real estate holdings. The company continued to grow its portfolio with significant retail and office acquisitions, enhancing geographic and sector diversification. Its monthly NAV calculation process, overseen by an independent valuation committee, underpins share pricing transparency but faces strain from increased redemption activity. Key risks include market-driven NAV fluctuations, leverage management amid interest rate uncertainty, and distribution sustainability under evolving liquidity dynamics.
Q2 Performance Reveals Strain on NAV-Associated Liquidity Mechanism
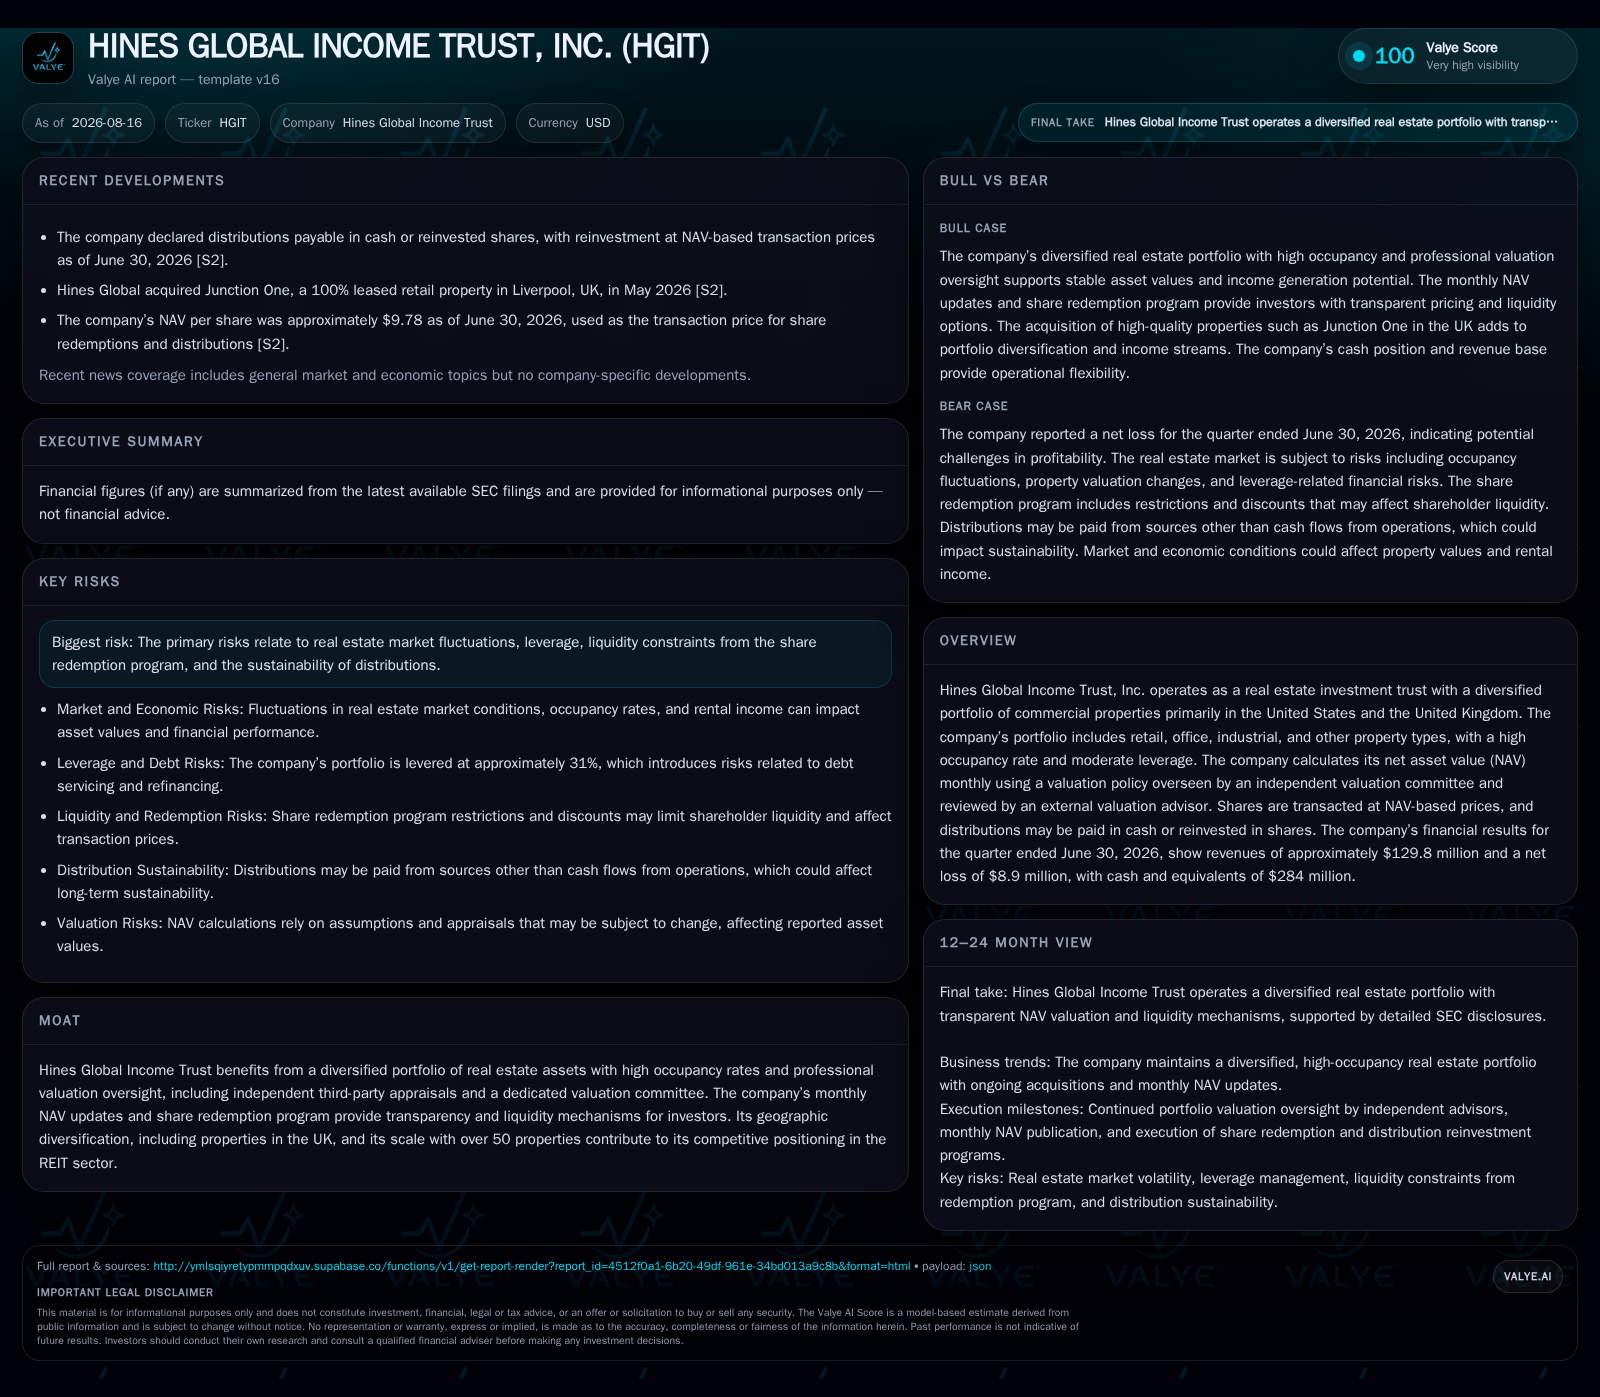
For the quarter ended June 30, 2026, Hines Global Income Trust (HGIT) posted revenues of approximately $129.8 million derived largely from rental income across its diversified commercial property portfolio but reported a net loss near $8.9 million [S2][F1]. This disconnect suggests pressure points likely stemming from non-cash items such as unrealized depreciation or mark-to-market shifts in asset valuations rather than operational weakness alone. The company maintains high portfolio occupancy rates characteristic of diversified REITs; however, ongoing share redemptions funded through cash balances may be intensifying liquidity demands that temper distributable cash flow [S2]. HGIT’s monthly net asset value (NAV) updates directly impact share pricing under its liquidity model. Elevated redemption activity can create downward NAV pressure when asset valuations lag or market discounts widen relative to intrinsic values.
Portfolio Expansion Accelerates: Impact of Recent Acquisitions on Diversification and Risk
During mid-2026, HGIT notably expanded its asset base with three significant property acquisitions: the Design Center of the Carolinas (retail/workspace), Wicker Park (retail), and 405 Colorado (office) totaling approximately 628,000 square feet combined [S3][S18][S21]. These additions enhance geographic diversification across key U.S. markets including Charlotte, Chicago, and Austin while spreading sector exposure between retail and office properties. Such diversification is a strategic buffer against localized economic shocks affecting occupancy or rental rates. Furthermore, these recent purchases suggest the company is active in deploying capital opportunistically where underwriting fundamentals align with long-term NAV accretion goals. Acquisition volume also demonstrates continuing access to financing despite a cautious leverage posture.
Valuation Governance: The Role of Independent Committees in Reinforcing NAV Transparency
A cornerstone of HGIT’s business model is its robust valuation oversight infrastructure. The firm calculates NAV monthly using a comprehensive policy approved by its board-directed valuation committee comprised of independent directors [S1][S23]. External appraisals are performed annually by Altus Group U.S. Inc., whose impartial reviews supplement internal discounted cash flow methodologies driven by the investment advisor. This governance architecture enhances transparency compared to typical closed-end funds that lack updated NAV-based share pricing. By publishing transaction prices aligned with monthly NAV per share for each class of stock and operating partnership units, HGIT fosters investor confidence in price discovery that reflects up-to-date underlying asset values rather than stale market quotes or subjective trading benchmarks.
Competitive Backdrop: Positioning Within Diversified Equity REIT Benchmarks
While not a publicly traded REIT in the traditional sense—operating more like a continuous offering interval fund—HGIT’s operational profile invites comparisons with large diversified equity REITs such as Prologis and Boston Properties known for their geographic breadth and sector variety. Unlike those peers who trade on public exchanges with continuous liquidity but less frequent NAV disclosures, HGIT stands out through its monthly NAV updates intertwined with a share redemption program providing measured investor liquidity not typical for interval funds or private real estate vehicles. However, this hybrid liquidity approach introduces unique risks around redemption-induced cash flow volatility not usually encountered by listed REITs backed by larger scale capital pools.
Growth Prospects: Economic Trends Driving Commercial Real Estate Demand and Rental Income Enhancement
Macro-economic conditions including steady U.S. GDP growth underpin demand for commercial real estate space occupancy which supports HGIT’s rental income stability—a primary driver of funds from operations (FFO) though specific FFO figures were not disclosed this quarter [S3][S18]. Additionally, continued property acquisitions funded prudently reflect management’s view on accretive growth opportunities within mature urban submarkets exhibiting robust tenant demand profiles. Leasing momentum coupled with geographic diversification reduces concentration risk while positioning the portfolio to capitalize on rising rental rates in inflationary environments bolstered by low vacancy trends.
Risk Perspectives: Interest Rate Sensitivity, Redemption Program Pressures, and Distribution Sustainability
Key risks emerge chiefly from interest rate uncertainty affecting refinancing costs on approximately $2.05 billion in total debt outstanding as of June 30, 2026 [F1]. HGIT’s net debt position near $1.77 billion after deducting $284 million in cash equivalents requires disciplined capital management given that incremental borrowing cost escalations could compress cash flow margins essential for funding distributions [F1]. Moreover, reliance on a share redemption program offers investor liquidity yet could exacerbate short-term cash demands if redemptions scale beyond available liquid resources or force distress sales at unfavorable valuations [S2][S1]. Lastly, real estate market cyclicality influencing occupancy rates or capital appreciation poses valuation uncertainty impacting NAV calculation accuracy despite rigorous oversight mechanisms.
'Eyes on the Horizon': Key Operational Milestones and Financial Metrics to Monitor Next Quarter
Upcoming quarterly reports should be monitored closely for shifts in key operational variables such as occupancy rates especially at newly acquired assets which currently show leasing between 88% and 100% [S18][S21], trends in adjusted funds from operations (AFFO) releasing greater insight into distributable cash flow health, and any adjustments in leverage stemming from refinancing or additional acquisitions [S2][S3]. Monthly published NAV per share alongside share redemption activity will continue serving as critical barometers for shareholder sentiment and liquidity dynamics.
Financial Profile Discussion
As of June 30, 2026, HGIT reported cash and equivalents totaling approximately $284 million against total debt obligations near $2.05 billion resulting in net debt around $1.77 billion [F1]. The combination of solid rental revenue generation ($129.8 million for Q2) contrasted with a $8.9 million net loss reflects non-cash charges likely associated with mark-to-market adjustments or finance-related costs detailed by management in their filings [S2][F1]. Liquidity appears adequate but requires careful monitoring given ongoing redemption program obligations. The company’s leverage level remains within moderate range relative to asset base valuations but sensitivity to interest rates remains a pivotal financial risk vector moving forward.
This analysis synthesizes publicly available quarterly filings supported by industry knowledge without providing investment advice or speculative projections. It aims to contextualize Hines Global Income Trust’s operating metrics within its business model framework alongside relevant peer comparisons and sector-specific risks.
Disclaimer: This is research-only, informational analysis and not investment advice. It may include AI-generated interpretation and general industry context. Always verify important details using primary sources.

Comments