
Capital Allocation and Market Stagnation Shape InPoint’s Financial Outlook
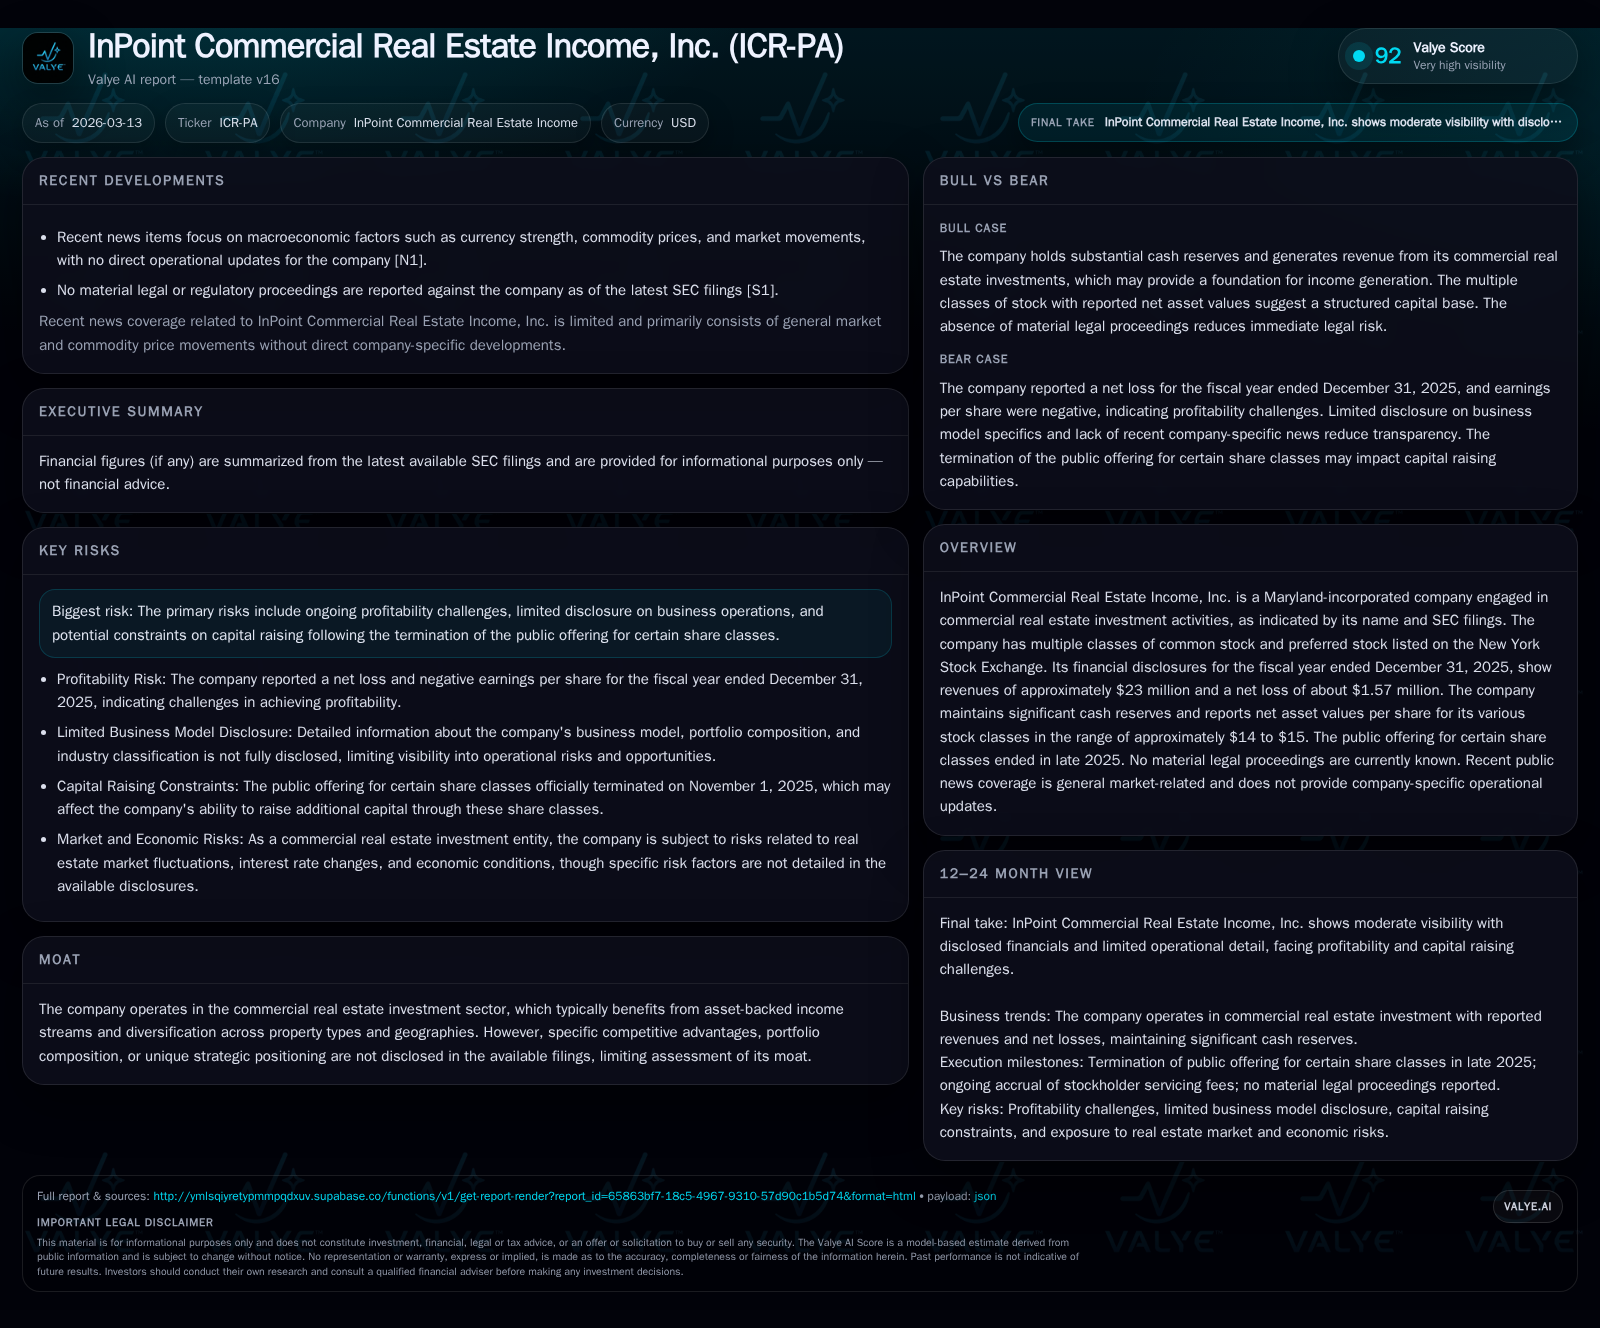
InPoint Commercial Real Estate Income, Inc. reported weakening revenue and profitability in 2025 while maintaining strong liquidity and ongoing dividends.
InPoint Commercial Real Estate Income, Inc. experienced a 5.7% year-over-year decline in revenues to $23.0 million in fiscal 2025, accompanied by a swing to a net loss of $1.57 million after previous profitability. Operating cash flow also contracted by over one-third compared to the prior year. Despite these challenges, the company reported solid cash equivalents of $76.6 million and continued paying consistent dividends across multiple classes of common and preferred shares throughout the year. The termination of its public offering in late 2025 limits near-term capital raising, posing growth constraints amid the commercial real estate market uncertainties. Investors should monitor key metrics such as NAV per share trends, liquidity status, and distribution sustainability to gauge forward momentum.
Evidencing Past Performance: Revenue Contours and Profitability Shifts
InPoint Commercial Real Estate Income's financial trajectory over the last four fiscal years reveals volatility emblematic of broader pressures in the investment real estate space. Revenue peaked at roughly $38.8 million in FY2023 before contracting notably to about $24.4 million in FY2024 and further down to $23.0 million by FY2025—a cumulative decline exceeding 40% from the three-year high point [F1]. This recent step down corresponds with continued challenges turning asset income into net profits.
The net income line exhibits an uneasy pattern: FY2022 returned a profit of approximately $10.2 million that flipped negative in FY2023 (-$4.4 million), rebounded strongly to nearly $12.7 million in FY2024, then reversed sharply again into a loss of about $1.57 million for FY2025, representing an over 110% deterioration year-on-year [F1]. This swing underscores episodic volatility potentially linked to asset valuations or impairment charges common within blind pool commercial real estate investment vehicles.
Operating cash flow (CFO) followed a similar deterioration path, dropping from an already reduced $18.5 million in FY2022 to its trough near $11.4 million by end-2025—a more than one-third decrease from the prior year’s level [F1]. Notably, capital expenditures ceased entirely in FY2025 compared with minimal spend previously ($62k in FY2024), highlighting a lack of reinvestment or acquisition activity during this period [F1].
Historical performance (annual)
| FY | Rev ($mm) | Net ($mm) | CFO ($mm) | Capex ($) | Rev YoY | Net YoY |
|---|---|---|---|---|---|---|
| 2025 | 23 | -2 | 11 | 0 | -5.7% | -112.4% |
| 2024 | 24 | 13 | 18 | 62000 | -37.1% | +385.5% |
| 2023 | 39 | -4 | 16 | +1.9% | -143.6% | |
| 2022 | 38 | 10 | 19 |
Source: SEC companyfacts cache [F1].
Capital returns and efficiency (annual)
| FY | Div ($mm) | Buybacks ($mm) | FCF ($mm) |
|---|---|---|---|
| 2025 | 13 | 11 | |
| 2024 | 13 | 0 | 18 |
| 2023 | 13 | 22 | |
| 2022 | 12 | 22 |
Source: SEC companyfacts cache [F1].
*Revenue YoY includes large volatility mainly from FY23 base.
Balance Sheet Strength vs Earnings Volatility
Despite earnings pressures, InPoint maintains a substantial liquidity profile evidenced by cash and equivalents totaling nearly $76.6 million at December 31, 2025 [F1]. Total equity measured approximately $226 million at fiscal end—down moderately from prior years yet providing a buffer against operational losses and market fluctuations [F1]. NAV per share varies by stock class but generally rests between about $14 to $15 based on disclosed NAV components through January-February 2026 updates [S8–S13, S28].
The balance sheet composition includes sizable commercial mortgage loans receivable ($351 million) and owned real estate assets ($99 million), offset by liabilities including repurchase agreements and mortgage loan payables totaling over $290 million combined—typical of leveraged real estate finance structures yet underscoring sensitivity to interest rates and credit conditions [S28]. The absence of detailed segment disclosures or portfolio specifics confines visibility into strategic moats or asset quality distinctions within the competitive landscape [S5].
Importantly, no material legal or regulatory proceedings were noted as pending or threatened as of the latest filings—a positive factor amid sector-wide transactional and regulatory complexity [S1,S4].
Unfolding Growth Prospects Amidst Public Offering Closure
A significant development shaping future capital flows was the official termination of InPoint’s public offering on November 1, 2025 [S8,S11,S16]. This cessation curtails access to fresh equity funding critical for expanding or refreshing the investment portfolio.
As a blind pool vehicle typically relying on primary offerings for acquiring commercial assets underpins growth opportunities, this restriction introduces headwinds towards sustaining expansion strategies absent opportunistic acquisition pipelines funded via internally generated cash flow or debt solutions.
Company disclosures highlight typical risks associated with blind pool formats including uncertainty surrounding timing and availability of investment opportunities aligned with investor commitments which can complicate growth forecasting or operational scaling efforts beyond current asset bases [S6].
Distribution Dynamics: Dividends and Preferred Stock Dividends Overview
InPoint sustains a consistent distribution policy across its multiple common stock classes with declared gross quarterly payouts approximating $0.1042 per share during late-2024 through early-2026 periods—paid largely in cash forming part return-of-capital/nondividend distributions along with associated tax treatments detailed for shareholders [S7,S14–S22].
Preferred shareholders receive quarterly dividends at an annualized rate of approximately 6.75%, supported by dedicated payout authorizations most recently confirmed for March 30, 2026 payments at $0.421875 per preferred share [S7,S17].
Net distributions vary among certain classes after deducting stockholder servicing fees—a standard practice that offsets broker-dealer services managing shareholder communications and other administrative conveniences tied primarily to Class D, T, and S shares . Despite overall negative net income in the latest year, dividend continuity indicates reliance on operating cash flow sufficiency and perhaps distribution smoothing mechanisms inherent within REIT setups.
Evaluating Capital Deployment: Buybacks, Servicing Fees, and Cash Allocations
Historical behavior shows cessation of share repurchases since fiscal year-end 2023 when nearly $22 million was expended on buybacks [F1,S16], reflecting a possible tilt towards preserving liquidity amid earnings headwinds rather than aggressive capital return via repurchasing programs going forward.
Stockholder servicing fees paid out annually amounting to mid-to-high hundreds of thousands dollars reflect structural advisory and broker-distribution costs inherent in multi-class REIT frameworks—specifically borne by holders of select classes such as Class T and D shares which reduces realized dividend yields slightly relative to declared gross amounts ([S8],[S16]). These fees do not enrich the Dealer Manager but are reallowed wholly as commissions to selling brokers providing ongoing investor servicing functions.
Free cash flow remains positive given zero capital expenditures in FY25 paired with operating cash flow generation around $11+ million—highlighting internal financing capacity albeit without supplemental external equity offerings currently available post-offering closure ([F1]).
Key Risks in the Commercial Real Estate Investing Landscape
Company filings underscore several risk vectors: profitability volatility stemming from asset performance fluctuations; credit risk exposure embedded within mortgage loan portfolios; interest rate sensitivity impacting borrowing costs; uncertainties tied to blind pool investment timing; and limited transparency on underlying portfolio details restraining investor clarity ([S4],[S6]).
These concerns collectively temper confidence regarding sustainable growth trajectories or distinct competitive advantages especially when balanced against industry cyclicality exacerbated by macroeconomic shifts such as inflationary pressures or changes in leasing demand patterns.
Forward-Looking Considerations: Tracking Upcoming Milestones and Market Indicators
Absent explicit forward guidance or formal analyst projections publicly available as of early-2026 ([N1],[S3]), observers should prioritize monitoring periodic liquidity updates including cash balances; trends in NAV per share disaggregated by stock class revealing valuation shifts; interest coverage ratios disclosing debt servicing ability; eventual announcements regarding refinancing activity; plus any resumption or innovation within their capital raising approach that might address funding constraints caused by ending primary offerings.
Further attention is warranted on dividend declarations relative to CFO margins as proxy signals for distribution sustainability.
This analysis relies solely on publicly disclosed financial data up through early March 2026 from InPoint Commercial Real Estate Income’s SEC filings plus general news commentary unrelated directly to company operations but noting sector conditions where relevant for context without speculation beyond stated evidence. The information contained herein does not constitute investment advice or recommendations regarding purchase or sale decisions.
Disclaimer: This is research-only, informational analysis and not investment advice. It may include AI-generated interpretation and general industry context. Always verify important details using primary sources.
Comments