
Knightscope’s Autonomous Security Robots: Balancing Growth and Profitability Challenges
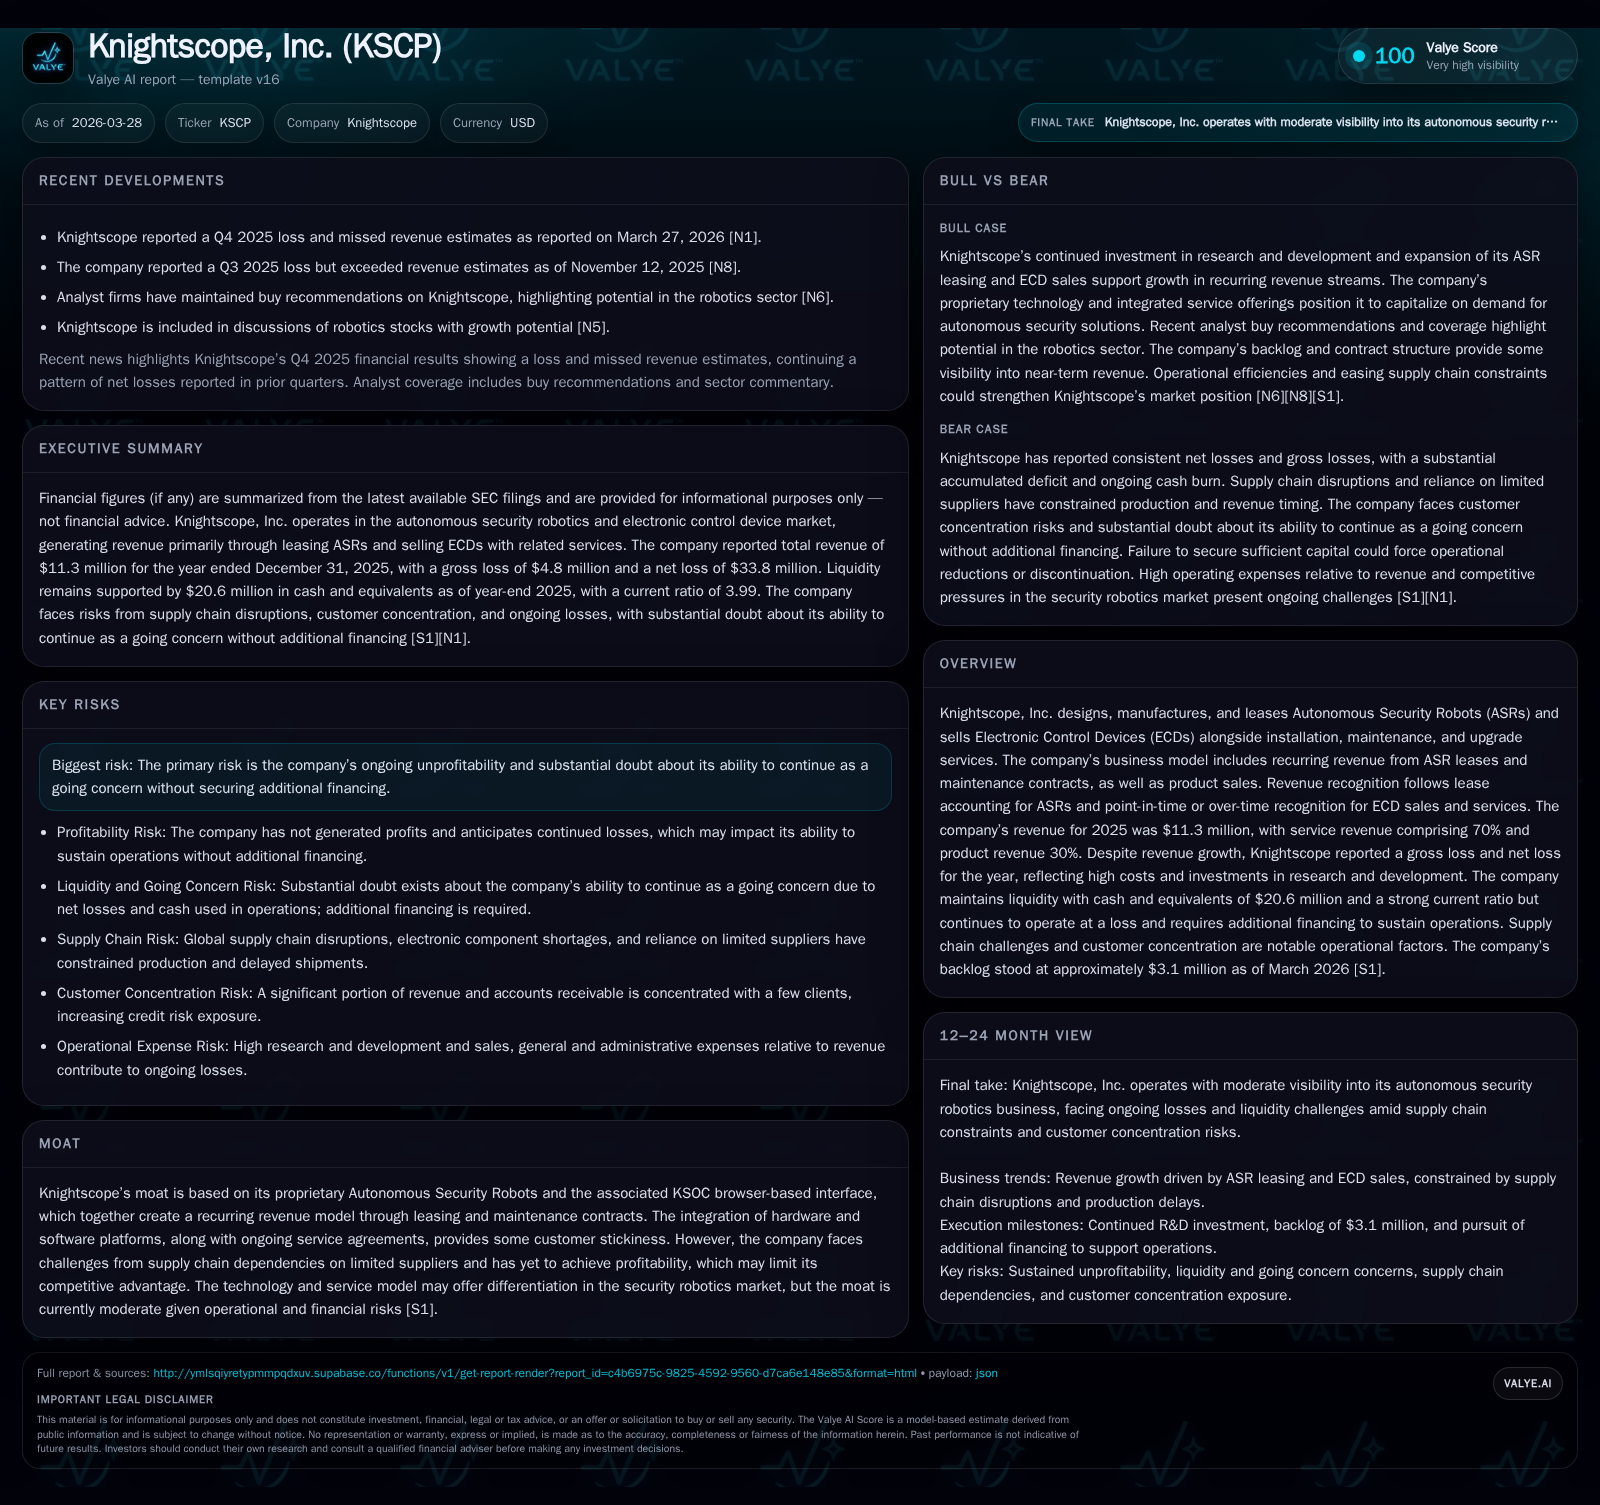
Knightscope leverages proprietary autonomous security robotics and a recurring revenue model but faces ongoing losses and capital demands.
Knightscope, Inc. has built a unique business model centered on its Autonomous Security Robots (ASRs) and the KSOC interface, which supports recurring revenues from leases and maintenance contracts. Despite growing revenues reaching $11.3 million in 2025, the company remains unprofitable with significant gross and net losses driven by high R&D expenses and elevated cost of sales. Its liquidity position is supported by $20.6 million in cash and near 4x current ratio, yet substantial doubt about going concern persists given cash burn exceeding operating inflows. Future growth opportunities hinge on scaling ASR lease deployments and expanding Electronic Control Devices (ECD) sales amidst supply chain constraints.
Historical Growth Dynamics Driven by Autonomous Security Robots and Service Expansion
Historical performance (annual)
| FY | Net ($mm) | CFO ($mm) | OpInc ($mm) | Capex ($) | Net YoY |
|---|---|---|---|---|---|
| 2025 | -34 | -30 | -34 | 654000 | -6.6% |
| 2024 | -32 | -22 | -30 | 43000 | -43.5% |
| 2023 | -22 | -24 | -26 | 457000 | +13.7% |
| 2022 | -26 | -24 | -32 | 111000 |
Source: SEC companyfacts cache [F1].
Capital returns and efficiency (annual)
| FY | FCF ($mm) | ROE% |
|---|---|---|
| 2025 | -31 | -121.8 |
| 2024 | -22 | -201.1 |
| 2023 | -25 | 83.0 |
| 2022 | -24 | 58.8 |
Source: SEC companyfacts cache [F1].
Knightscope's growth story over recent years has been anchored in its development of proprietary Autonomous Security Robots (ASRs), which it leases to customers alongside offering supporting services via its KSOC browser-based interface [S1]. The business model blends hardware leases with software-enabled management tools to foster recurring revenue streams.
In fiscal 2025, total revenue reached $11.3 million—a modest increase from $10.8 million in 2024—reflecting sustained expansion of service contracts that now constitute about 70% of total revenue, while product sales account for roughly 30% [F1][S1]. This balance signifies a maturing footprint of leased ASRs under preventative maintenance agreements and recurring service fees from customers who engage both lease and service components.
Despite this top-line growth trajectory, Knightscope remains unprofitable with net losses persisting since inception. The company's accumulated deficit stood at approximately $227 million as of December 31, 2025 [S4]. The rise in backlog to around $3.1 million for combined ASR ($0.6 million) and Electronic Control Devices (ECDs) ($2.5 million) orders hints at underlying demand momentum that may support future revenue expansion if operational challenges are navigated [S1].
Revenue Components: Leasing vs Product Sales and Their Impact on Margins
Knightscope recognizes revenue from ASR leases under lease accounting principles because ASR contracts typically span twelve months, providing predictable monthly recurring revenues from leased units as well as access to the KSOC interface [S1]. Non-lease-related revenues include professional services such as deployment assistance or training recognized upon transfer of control.
Conversely, ECD sales and associated installation or upgrade services are recognized at a point in time or over the contract completion period depending on specific customer agreements [S1]. This bifurcation results in distinct timing patterns affecting reported revenue each period.
The margin profile is adversely impacted primarily by the ASR side where depreciation expense is steadily recognized over an estimated asset life of 3 to 5 years due to intensive assembly labor hours embedded within the componentized cost structure [S1]. Additionally, cost allocations for shipping, routine maintenance, data fees, and direct labor are substantial contributors within cost of revenue.
This dynamic explains why despite service revenues constituting the majority share—normally associated with higher-margin SaaS-like businesses—the company still reports gross losses (42% margin deficit in 2025 vs 34% in 2024) reflecting continuing high costs tied directly to the hardware-intensive nature of the offerings [F1][S12].
Cost Structure and Profitability Trends Over Recent Years
Knightscope’s expense structure underscores significant investments into research and development alongside sizable sales & general administrative costs with notable operating leverage still out of reach.
Operating losses widened from $29.7 million in FY2024 to approximately $33.9 million in FY2025—a -14.2% decline year-over-year—driven mainly by soaring R&D expenses that rose by nearly 77% year-over-year to $12.5 million or an outsized 110% of revenue [F1][S11][S22]. This reflects both internal headcount increases related to engineering efforts plus outsourced third-party development engagements.
Sales & general administrative expenses saw a modest decline yet remained elevated at $16.6 million (147% of revenue), indicating continued overhead burdens from corporate functions including marketing, investor relations, legal/compliance costs, plus stock-based compensation [F1][S11][S22]. Depreciation related primarily to ASR assets also factors noticeably into cost allocations further weighing on overall profitability.
ROE remains significantly negative at approximately -122%, underscoring shareholder value erosion given persistent losses against equity levels totaling around $27.8 million as of December 2025 [F1].
Capital Allocation Efforts Amid Continued Operating Losses
Capital strategies focus predominantly on equity issuances supplemented by debt financings primarily through unsecured Public Safety Infrastructure Bonds bearing coupon rates near 10%, designed to extend operational runway amid cash-intensive phases [S6][S7]. Total outstanding debt approximated $4.4 million end-2025 with non-current portion nearly stable around $4 million [F1][S6].
No dividends or share buyback programs have been executed reflecting minimal free cash flow generation due to ongoing negative cash flows coupled with sizeable accumulated deficits precluding distributions [S24]. Instead, management has prioritized recapitalization efforts through registered direct offerings, At-The-Market (ATM) facilities, convertible notes retirement transactions, and equity shelf registration statements aimed at preserving liquidity flexibility [S10][S24]. Equity increased notably from approximately $15.8 million in FY2024 to about $27.8 million FY2025 aided by these capital infusions ([F1]).
Liquidity Position and Financing Strategies Extending the Runway
At year-end December 31, 2025 Knightscope held approximately $20.6 million in cash and equivalents with current assets of about $26.4 million against current liabilities near $6.6 million—a robust current ratio near 3.99 indicating ample short-term solvency buffers [F1][S4]. However, net cash used in operating activities surged roughly 35% to just over $30 million for FY2025 compared to prior year reflecting accelerated spending on personnel, infrastructure investments including expanded headquarters facilities alongside increased working capital requirements principally relating to accounts receivable collections cycles [F1][S8][S21].
Due to this continued cash burn trajectory paired with significant accumulated deficits exceeding $227 million management explicitly flags "substantial doubt" regarding its going concern status within disclosures citing dependence on successful acquisition of additional financing sources through equity or debt channels over the near term [S4][S8][S10]. Failure to secure adequate funding could necessitate scaling back operations or discontinuance ultimately impacting viability.
Growth Outlook: Opportunities in Recurring Revenue and Market Penetration Challenges
Knightscope's growth potential remains closely tied to increasing adoption rates for its autonomous security robot leases coupled with broadening electronic control device sales assisted by preventive maintenance contracts that build longer-term customer relationships providing stickiness via its integrated KSOC interface platform [N1][S1]. Backlog rose modestly during FY2025 totaling approximately $3.1 million chiefly weighted towards ECD orders ($2.5 million) signaling stable demand pipeline though not without supply chain hurdles limiting expedited fulfillment capabilities [S1].
Recent financial reports underscored a Q4 revenue miss illustrating risks related to operational scale-up challenges amid component shortages directly affecting deployment cadence impacting near-term top-line progression prospects despite fundamental technology appeal confirmed via multi-year contracts backdrop [N1][S1].
Risks from Supply Chain Dependencies and Going Concern Doubts
Key vulnerabilities encompassed within Knightscope’s risk matrix revolve around its dependency on a small group of suppliers for critical components integral to assembling both ASRs and ECDs—several requiring certification or regulatory compliance thereby restricting alternate sourcing options short term thus constraining manufacturing flexibility [S14][S26][N1]. The combined pressure exerted by this supply concentration intertwines with ongoing technical innovation demands translating into elevated R&D spend while profitability remains elusive.
Additionally recurring financial pressures emerging from bond debt servicing obligations alongside escalating cash burn raise uncertainties pertaining to sustainability absent timely successful capital raises compounding doubts flagged explicitly about the company’s ability "to continue as a going concern" without significant incremental funding within twelve months horizon post report date securitizations [S4][S14][N1].
What Investors Should Monitor: Key Metrics and Upcoming Milestones
Future monitoring should emphasize quarterly trends including:
- Lease deployment volumes for ASRs signaling market traction progression beyond backlog figures.
- Conversion rates comparing backlog order book versus delivered installations reflecting operational scalability.
- Revenue composition shifts between lease/service versus product sales elucidating margin improvement potential.
- Quarterly cash flow burn rate fluctuations detailing operational efficiency or cost control effectiveness.
- Capital raise announcements or strategic partnerships potentially alleviating liquidity stressors.
- Progress updates related to technology upgrades especially enhancing KSOC platform functionality or robot autonomy improvements affecting competitive positioning.
- Renewal rates on preventative maintenance agreements underpinning recurring service incomes stabilizing revenue streams.
- Regulatory developments influencing product certifications impacting supplier flexibility or cost profiles. While no formal guidance has been issued externally by management beyond known milestones such as strategic acquisitions targeting complementary business lines intended to augment free cash flow positive prospects long term investors should scrutinize these indicators closely for insights into trajectory shifts [N1][S3].[N1]
Disclaimer: This analysis is based solely on publicly available information as extracted from SEC filings and recent news releases without any speculative inputs or forecasts generated beyond stated facts herein; it does not constitute investment advice or recommendations.
Disclaimer: This is research-only, informational analysis and not investment advice. It may include AI-generated interpretation and general industry context. Always verify important details using primary sources.
Comments