
PermRock Royalty Trust's Income Stream: Risks, Rewards, and the Role of Underlying Operations
An analysis of PermRock Royalty Trust’s financial results and structural dynamics highlights its dependence on commodity prices and third-party operators within the Permian Basin.
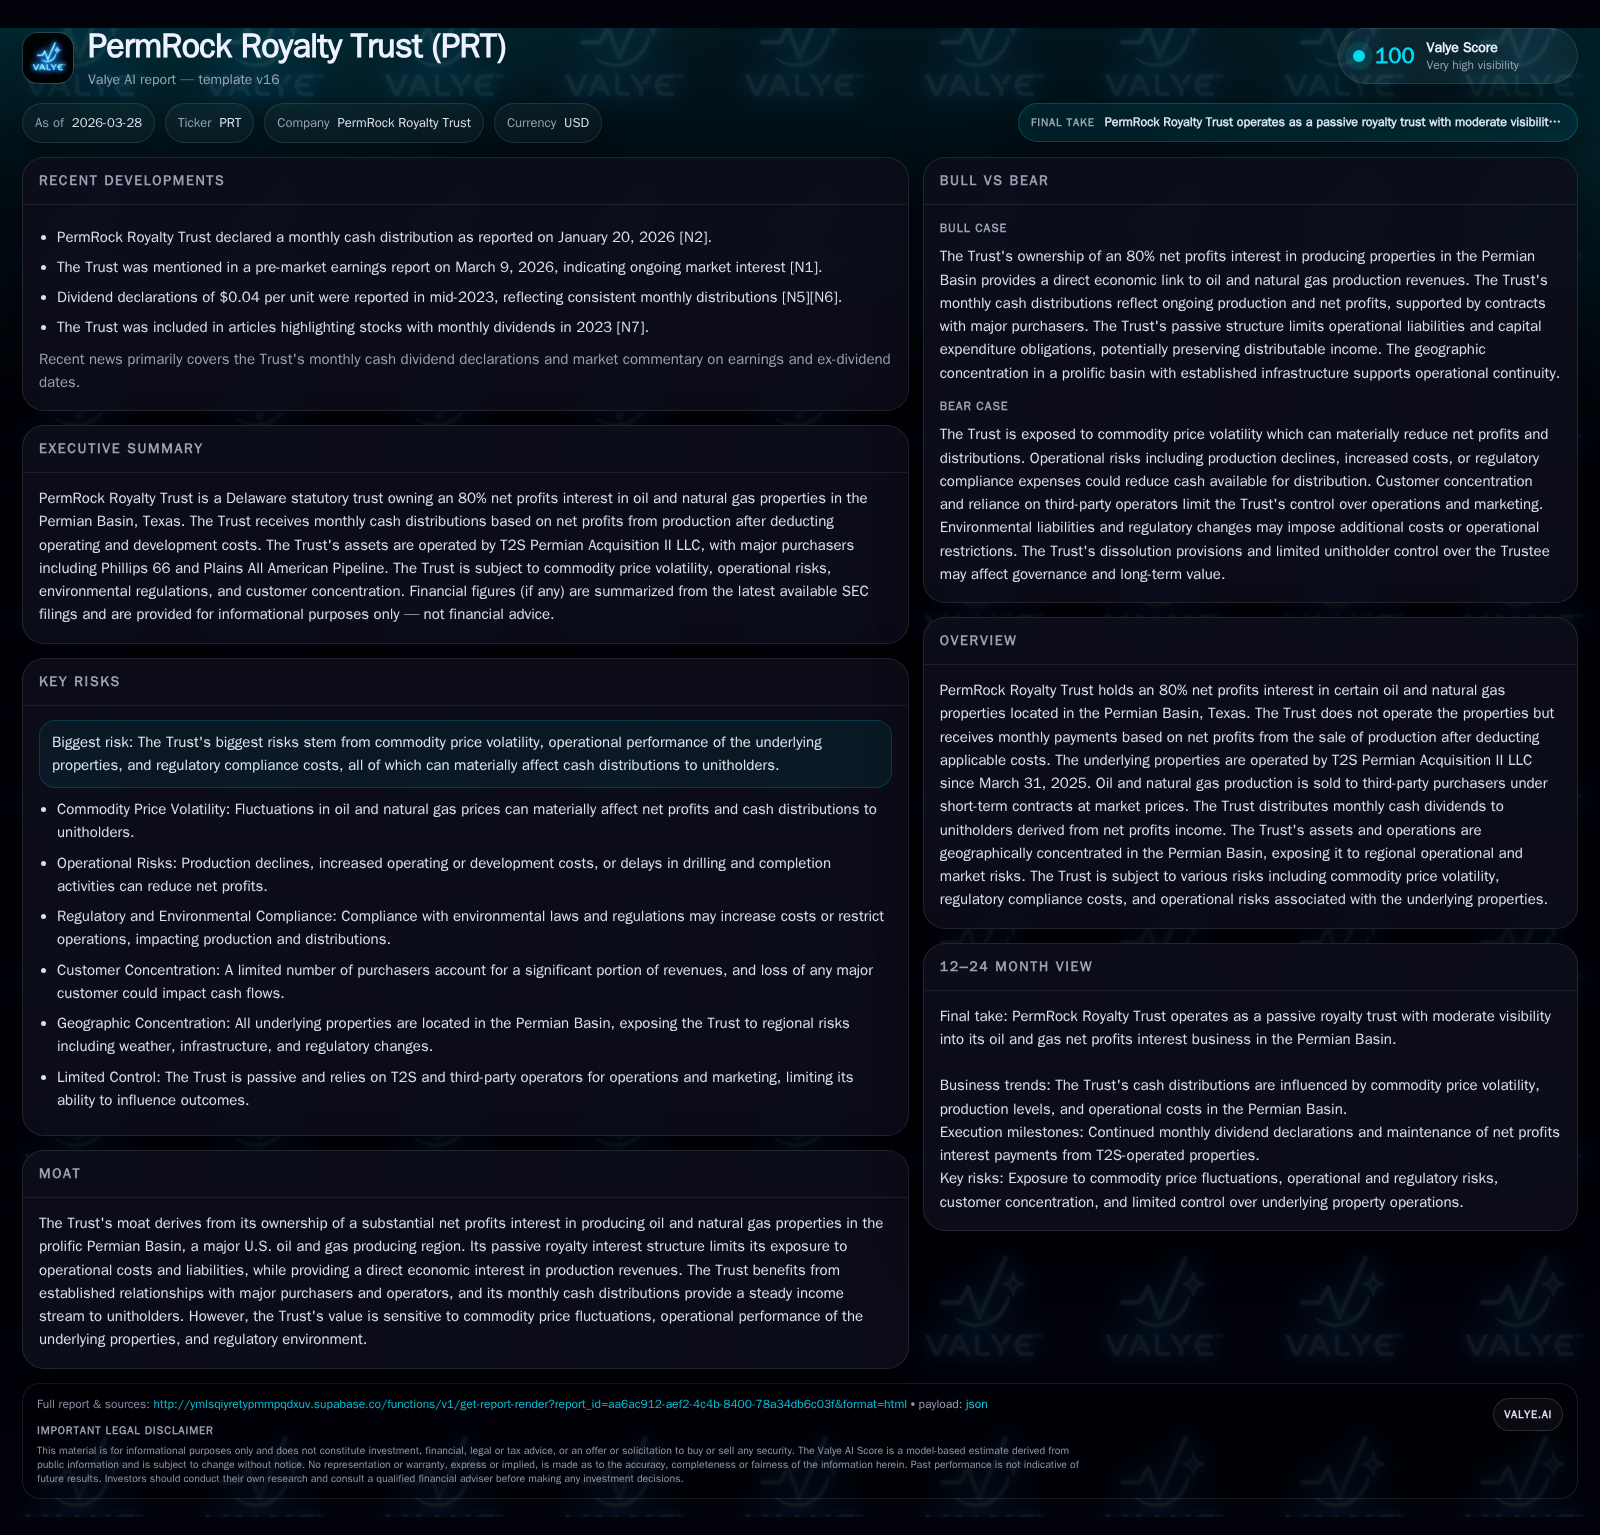
PermRock Royalty Trust holds an 80% net profits interest in producing oil and natural gas properties in Texas’ Permian Basin, relying on operators and market prices that drive its monthly cash distributions. Its royalty structure offers limited operational exposure but subjects unitholders to commodity price fluctuations, regulatory risks, and operational uncertainties inherent to the underlying properties. While production volumes and pricing remain critical to distribution stability, capital allocation is focused on monthly income pass-through with minimal retained liquidity. Future growth hinges largely on operator activity, commodity cyclicality, and regulatory environment changes.
Historical Performance: Royalty Revenues and Market Impact
PermRock Royalty Trust’s income is principally derived from an 80% net profits interest in oil and natural gas assets situated in Texas’ prolific Permian Basin. Since March 31, 2025, the underlying properties have been operated by T2S Permian Acquisition II LLC. The Trust does not operate these assets but receives monthly cash flows based on net profits — essentially revenues from production sales less certain operating costs borne by the operator.
Annual results reflect a strong sensitivity to both production volumes from underlying wells and prevailing commodity price environments. For fiscal year ending December 31, 2025, available disclosures suggest monthly distribution variability closely tracked oil price volatility during that period [S1][S3]. This performance pattern reflects the pass-through nature of the Net Profits Interest (NPI), with revenue swings primarily driven by fluctuating product sales prices rather than operational decision-making at the trust level.
| Fiscal Year | Notes |
|---|---|
| Until 2024 | Initial operator Boaz Energy era; production commencement with typical commodity price volatility influencing payouts |
| 2025 | Transition to T2S as operator; ongoing price curve volatility; monthly variable distributions tied to net profits interest deductions [S1], [S3] |
While detailed line-item financials for prior years are limited in public filings, the pattern of variable distributions underpins the trust’s dependency on external market forces.
Commodity Price Influence on Cash Distributions and Production Dynamics
The Trust’s monthly unitholder distributions are tightly coupled with real-time oil and natural gas prices achieved by third-party purchasers through short-term contracts. Operators sell crude oil primarily under geographic pricing benchmarks adjusted for quality differentials; natural gas is sold referencing regional index prices after adjustments for Btu content and transportation charges [S6].
This linkage means realized royalties inherit swings typical of upstream commodity markets. The Trust's distributable net profits act as a residual income stream post-deduction of operating expenses allocated by the operator. Given contract terms emphasizing short duration at market rates, any rapid downturn in benchmark prices translates swiftly into reduced royalty proceeds [N1], underscoring pronounced payout sensitivity.
Furthermore, production volumes contribute materially — dependent upon operators’ well productivity management, drilling activity levels influenced by capex budgets, and secondary recovery techniques such as waterflooding employed within reservoirs [S8]. Production curtailments driven by regulatory limits or infrastructure constraints also play a role in output fluctuations.
Conceptually, this means understanding PRT’s yield volatility requires monitoring benchmark prices like WTI and Henry Hub alongside operational signals from T2S’s management of the producing acreage.
Operational Structure: Passive Royalties and Third-Party Operators’ Role
PRT's legal claim is passive — as holder of an 80% Net Profits Interest — meaning it benefits economically without participating in field management or cost liabilities [S21]. The Trust functionally acts as a royalty recipient collecting distributable net profits after deduction of lease operating expenses (LOE), development expenditures funded by operators, transportation costs, taxes related to operations, and other agreed deductions.
Since March 2025, T2S has been the primary operator responsible for day-to-day activities including well drilling/completions, production optimization programs, facility maintenance, environmental compliance measures, marketing arrangements with third parties (including major buyers such as Phillips 66), and capital expenditure planning [S1], [S6].
This arrangement mitigates direct exposure to capital risk for unit holders but raises dependence on operator competence amid a competitive industry landscape with players of varying financial strength. Operator failures or strategic shifts can curtail development activities thereby reducing royalties payable. Conversely, effective reservoir management boosts future net profits facilitating stable or growing distributions.
Risks Specific to PermRock’s Net Profits Interest in the Permian
The Trust faces multifaceted risks stemming primarily from its exposure to commodity cycles compounded by its geographic concentration within the Permian Basin:
- Commodity Price Volatility: Sudden price downturns erode proceeds; protracted slumps depress lifetime value of reserves impacting distributable income [S5], [S7].
- Reserve Uncertainties: Proven reserves deplete over time; future production estimates carry uncertainty tied to reservoir performance; secondary recovery success is critical yet unpredictable [S14].
- Operational Risks: Dependence on T2S or successor operators for maintenance of production volumes introduces execution risk including equipment failures or drilling delays [S7], [S14].
- Regulatory Compliance Costs: Environmental laws governing air/water quality standards, waste disposal including emerging PFAS chemical handling rules may increase operating costs passed through as deductions against net profits [S10], [S12], [S25].
- Geographic Concentration: All assets lie within one region susceptible to local weather events, infrastructure bottlenecks or regional regulation changes creating aggregate vulnerability [S6], [S14].
- Market Dynamics: Competition for equipment/personnel at local level affects cost base; fallback risk from major purchasers is low due to market breadth but remains present [S6].
- Other Risks: Operator bankruptcy or property abandonment could extinguish associated NPIs stopping corresponding cash flows altogether [S14]. Cybersecurity threats targeting Trustee systems pose governance risks albeit low probability [S16].
These risks translate directly into potential variability or reduction in cash distributions expected by unitholders.
Capital Allocation Overview: Distribution Policy and Liquidity Position
The Trust operates with a pass-through model wherein virtually all net profits income received monthly is distributed promptly after administrative fees. Distributions are made monthly around ten business days post-record date reflecting sales approximately one month prior [S21]. The Trustee maintains only nominal cash reserves intended for trust administration or contingencies but avoids significant retention that would reduce payments to unitholders.
There are no disclosed share repurchases or reinvestment programs; capital returns take the form exclusively of royalty cash flow disbursement. This absence reflects the trust structure which limits discretionary capital deployment options intrinsic to traditional corporate issuers.
Liquidity conditions appear stable as operational cash receipts fund ongoing payouts without leveraging or financing dependencies because operating costs are borne entirely by operators before calculating distributable net profits.
Future Outlook: Production Drivers, Pricing Scenarios, and Watchpoints
Explicit forward guidance is scarce but selective disclosures outline key factors shaping future dynamics:
- Commodity Price Trajectory: Benchmark oil pricing influenced by OPEC+ decisions globally alongside geopolitical events will continue driving realized revenues affecting trust income streams [N1], [S8].
- Operator Investment Plans: T2S’s capital expenditure budgets for drilling new wells or enhanced recovery investments determine growth potential in production volumes supporting higher royalty income levels [S8].
- Reserve Life & Secondary Recovery Efficacy: Successful application of enhanced recovery enhances estimated future net revenues prolonging asset life; failure accelerates depletion ensuring natural long-term decline in distributions [S14].
- Regulatory Environment: Increasing restrictions or costs related to emissions controls or waste handling could weigh on profitability negatively filtering down to royalties distributed. Watch EPA rulemaking and state-level legislation updates closely.
- Market Position & Contract Stability: Monitoring counterparty creditworthiness among buyers as well as pipeline capacity conditions necessary for uninterrupted sales remains important.
In summary, while volatile prices underpin earnings variability near-term growth prospects align tightly with operator success executing development plans within a complex regulatory frame.
Analyst’s Take: Critical Milestones and Metrics to Monitor
Key variables investors should track include:
- Monthly realized pricing relative to WTI & Henry Hub benchmarks incorporating differentials applied regionally.
- Production data transparency including well counts, completion rates disclosed by T2S relevant to reserve replacement progress.
- Trends in operating expenses that affect deductions against gross revenue impacting net profits returned.
- Regulatory developments such as new air quality standards or PFAS-related waste classification potentially increasing compliance burden.
- Changes in operator strategy such as shifts in capex or disposition of underlying assets which could alter distribution sustainability.
- Trustee announcements concerning liquidity cushions or litigation outcomes affecting trust unilateral administration.
Unlike conventional upstream equities where control allows operational sway over results, PRT investors’ returns hinge disproportionately on external operator execution quality combined with uncontrollable market price movements—an essential distinction shaping risk-reward calculus unique to net profits interest trusts.
This analysis synthesizes PermRock Royalty Trust's structural features alongside known operating facts while respecting disclosure limitations. It does not constitute investment advice but aims at illuminating the nuanced interactions between commodity cycles, passive ownership interests, operational dependencies, and resulting cash flows characteristic of midstream royalty trusts active in major U.S. basins such as the Permian.
Disclaimer: This is research-only, informational analysis and not investment advice. It may include AI-generated interpretation and general industry context. Always verify important details using primary sources.
Comments