
Ligand Pharmaceuticals Expands Royalty Portfolio While Managing Credit and Regulatory Risks
Ligand’s Q1 2026 report highlights steady royalty revenues, strategic acquisitions, and robust liquidity underpinning its biopharma licensing model.
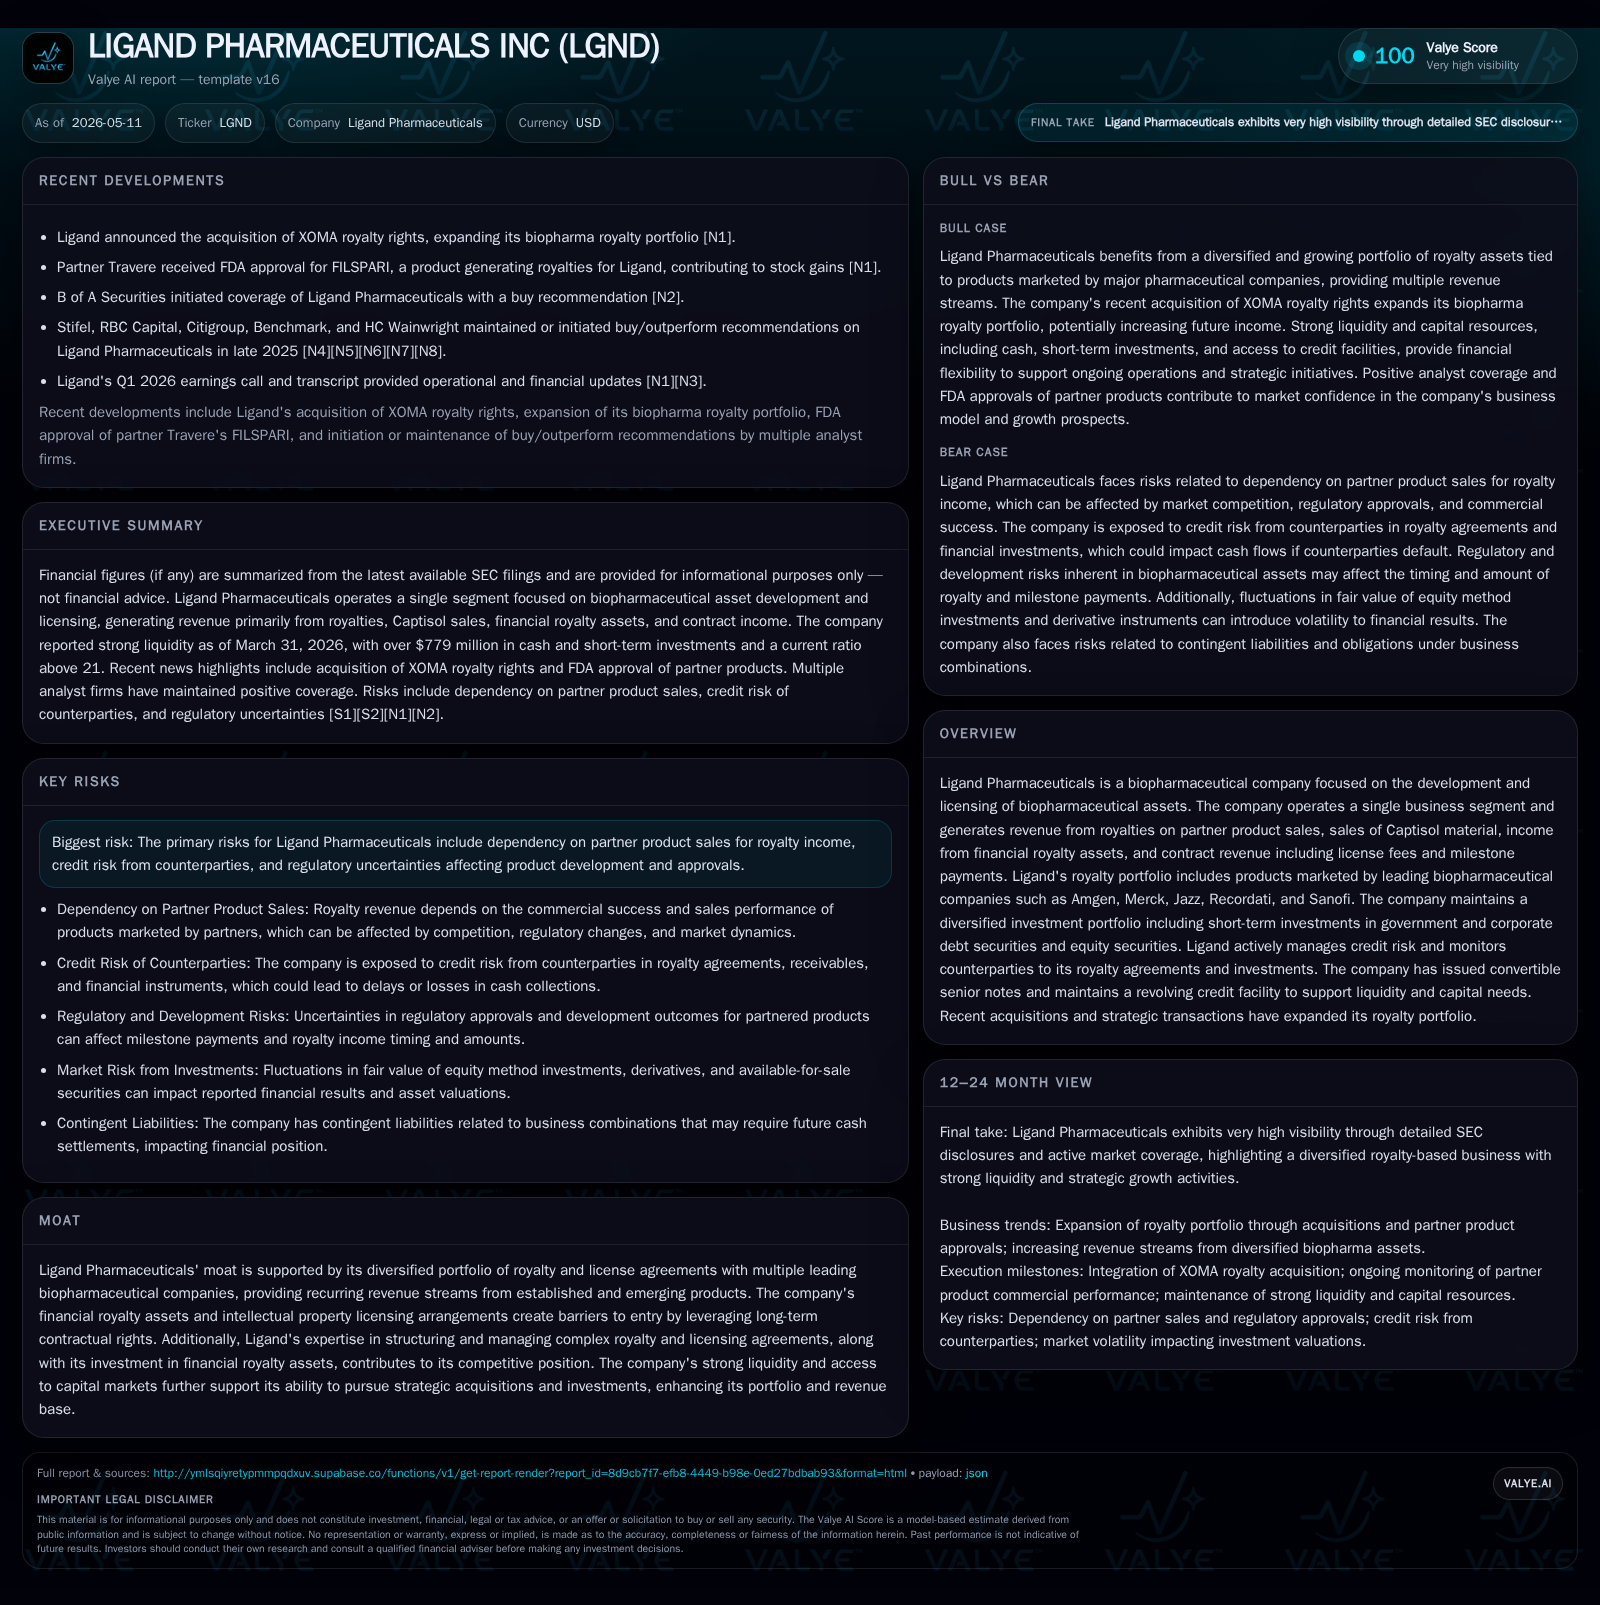
Ligand Pharmaceuticals reported consistent financial performance in Q1 2026, underpinned by royalties from partner product sales and contract revenue. The company’s recent acquisition of XOMA Royalty expands its biopharma royalty portfolio, enhancing revenue diversification amid regulated industry dynamics. Ligand’s business model centers on leveraging licensing agreements, royalties, and Captisol sales, supported by strong counterparty credit management and liquidity. Key growth drivers include expanding royalty streams via strategic investments and new product approvals from partners. Risks stem primarily from dependency on partner sales, regulatory uncertainty, and supply chain concentration for Captisol production.
Recent Operating Update
Ligand Pharmaceuticals’ latest quarterly filing dated May 8, 2026 ([S2]) provides the freshest insight into its operating status for Q1 2026. The report confirms continued royalty income from partner product sales alongside revenue recognized from contract fees and milestone payments. Captisol sales — a critical raw material enabling drug delivery — remain a steady contributor. Notably, a recent event filing on May 7, 2026 ([S3]) highlights completion of the acquisition of XOMA Royalty which significantly strengthens Ligand’s royalty portfolio by adding commercial-stage assets and pipeline candidates. This acquisition synergizes with Ligand’s core strategy of growing recurring revenues through intellectual property licenses rather than direct drug commercialization.
The company emphasizes stable operating conditions without material changes to its disclosed risk factors ([S2]). The robustness of its capital structure is suggested by ample cash balances exceeding $115 million as of March 31, 2026 ([F1]) supporting both organic initiatives and acquisition financing. Together, these filings confirm Ligand’s execution focus on leveraging biopharma partnerships while capitalizing on financial assets tied to promising drug royalties.
Business Model Overview
Ligand operates predominantly in a single business segment focused on the development and licensing of biopharmaceutical assets ([S1]). Its revenues are primarily derived from:
- Royalties: Payments contingent on sales performance of products commercialized by partners such as Amgen, Merck, Jazz Pharmaceuticals, Recordati, and Sanofi.
- Captisol Material Sales: Captisol is Ligand's proprietary cyclodextrin derivative used to enhance solubility and stability of injectable drugs; it is produced externally by a limited number of suppliers.
- Financial Royalty Assets Income: Interest-like yield generated by acquired royalties or milestone-based rights managed as investments.
- Contract Revenue: Including up-front license fees plus technical milestones that recognize progression events in partnered clinical or regulatory activities.
Revenue recognition aligns with ASC 606 standards where milestone payments are recognized once contractual thresholds are met ([S7]). Ligand's approach centers on enabling partner innovations while avoiding costly late-stage development risks; instead it collects recurring royalties through long-term contractual rights that create durable income streams.
The company also invests in early-stage assets via equity stakes or royalty purchases (e.g., Pelthos Therapeutics involvement), blending financial investment returns with strategic pipeline exposure ([S14]). Its balance sheet incorporates short-term government and corporate debt securities enhancing liquidity prudence ([S11]).
Industry Structure and Competitive Position
Ligand occupies an intermediary role within the broader biopharmaceutical ecosystem: it does not directly market drugs but specializes in licensing platforms like Captisol and acquiring royalties tied to approved products or development programs. Its competitive moat arises from:
- A diversified portfolio of royalty contracts across multiple biopharma partners reducing revenue volatility.
- Expertise in structuring complex financial royalty arrangements capturing long-term value beyond typical license agreements.
- Ownership of patented technologies with strong IP protections fueling Captisol demand by pharmaceutical developers requiring specialized excipients ([S10]).
- Access to capital markets evidenced by issuance of convertible senior notes (2030 Notes) allowing strategic acquisition financing ([S12], [S21]).
Despite competition from other licensing-focused entities or pure biotech investors in royalty funds, Ligand differentiates through proven capability to combine IP licensing with financial asset management initiatives alongside operational oversight of technology supply (Captisol).
Growth Drivers
Key growth drivers identified include:
- Expanding Royalty Base Through Acquisitions: The April-May 2026 acquisition of XOMA Royalty ([N2], [N3], [S3]) adds multiple commercial products and clinical candidates expected to generate near- to mid-term milestones plus ongoing royalties.
- Partner Product Approvals: Recent FDA approvals received by partners (e.g., Travere's FILSPARI for kidney disease) trigger increased royalty flows benefiting Ligand ([N6], [N7]).
- Captisol Demand Growth: Ongoing reliance by pharma companies on Captisol for challenging formulations positions this excipient sales stream for sustained support amid drug launch activity.
- Milestone Payments from Pipeline Progress: As partnered development programs advance through clinical stages or regulatory submissions successful achievement unlocks incremental contract revenue.
- Financial Asset Yield Expansion: Returns on invested royalty assets like Pelthos shares contribute non-operating income enhancing earnings accretion ([S1]).
Overall, these growth vectors balance near-term recurring income with longer horizon pipeline opportunities reflecting structural industry trends favoring asset-light licensing models paired with leveraged royalties.
Risks / Watchpoints / Growth Constraints
While Ligand’s model affords diversification benefits versus direct R&D risk exposure, several challenges remain:
- Dependency on Partner Sales: Royalty income depends heavily on continued commercial success of marketed products sold by third parties; any significant downturn in those sales can materially impact revenues ([S15]).
- Regulatory Approval Uncertainty: Pipeline royalties hinge on successful clinical trial outcomes and regulatory decisions which are inherently uncertain across approval geographies ([S25], [S17]).
- Credit Risk Exposure: Despite broad counterparty bases, defaults or bankruptcies among marketers could delay or reduce collection timing requiring close monitoring ([S15], [S16]).
- Supply Concentration of Captisol: Reliance on a single supplier (Hovione) for Captisol manufacturing presents operational risks should supply disruptions occur affecting product availability ([S10], [S16]).
- Foreign Currency Fluctuations: Revenues denominated outside the U.S. may be affected by adverse currency exchange movements impacting reported results ([S15], [S16]).
- Market Volatility Impacting Financial Assets: Investments in publicly traded equity securities introduce mark-to-market earnings volatility despite diversification attempts ([S1], [S15]).
These factors necessitate vigilant risk management practices including financial hedging where feasible alongside proactive engagement with partner companies.
What to Watch Next
Investors and analysts should monitor key upcoming developments such as:
- Integration progress and contribution metrics related to the XOMA Royalty acquisition including onboarding new partners’ revenue streams.
- Updates on clinical trial readouts or new drug approvals for partnered development-stage programs that could unlock milestone payments.
- Changes in Captisol production capacity or supplier arrangements particularly addressing supply concentration risks.
- Quarterly royalty revenue trends reflecting partner sales cycle seasonality or new product launches.
- Any amendments or expansions to credit facilities or debt refinancing impacting cost of capital conditions.
- Updates around macroeconomic conditions influencing investment portfolio valuations affecting non-operating income patterns.
These milestones will serve as tangible markers indicating how well Ligand is executing its asset-driven growth strategy while managing sector-specific headwinds effectively.
Financial Profile Summary
Latest financial snapshot
| Metric | Value | Period |
|---|---|---|
| Cash & equivalents | $115mm | |
| 2026-03-31 | ||
| Current assets | $865mm | |
| 2026-03-31 | ||
| Current liabilities | $41mm | |
| 2026-03-31 | ||
| Current ratio | 21.28x | |
| 2026-03-31 |
Source: SEC companyfacts cache [F1].
As of March 31, 2026, Ligand maintains a strong liquidity position backed by cash & equivalents totaling approximately $115 million with current assets exceeding current liabilities by more than 21 times (current ratio ~21x) signaling excellent short-term solvency ([F1]).
Operating income reached $41 million as per latest annual data ending December 31, 2025 with net income favored by non-operating gains deriving mainly from mark-to-market increases in equity-method investments ([F1], [S1]). Cash flow generation remains positive supporting sustainability without reliance solely on external financing for operational needs. Liquidity appears adequate for anticipated research funding commitments as well as opportunistic acquisitions highlighted by XOMA Royalty purchase announcement early in Q2 2026 ([N2], [N3]).
This analysis reflects a synthesis grounded exclusively in Ligand Pharmaceuticals’ most recent SEC filings complemented by public news sources without any speculation beyond stated data. Past financial performance is referenced strictly as supportive context rather than primary narrative driver.
All metrics cited are directly sourced from official documents designated above or validated companyfacts data points; no extrapolation was performed beyond disclosed information.
Disclaimer: This is research-only, informational analysis and not investment advice. It may include AI-generated interpretation and general industry context. Always verify important details using primary sources.
Comments