
Linde plc Powers Ahead with Steady Operating Growth and Premium Capital Returns
Linde plc sustains operating and net income growth alongside increased infrastructure investment and robust capital returns.
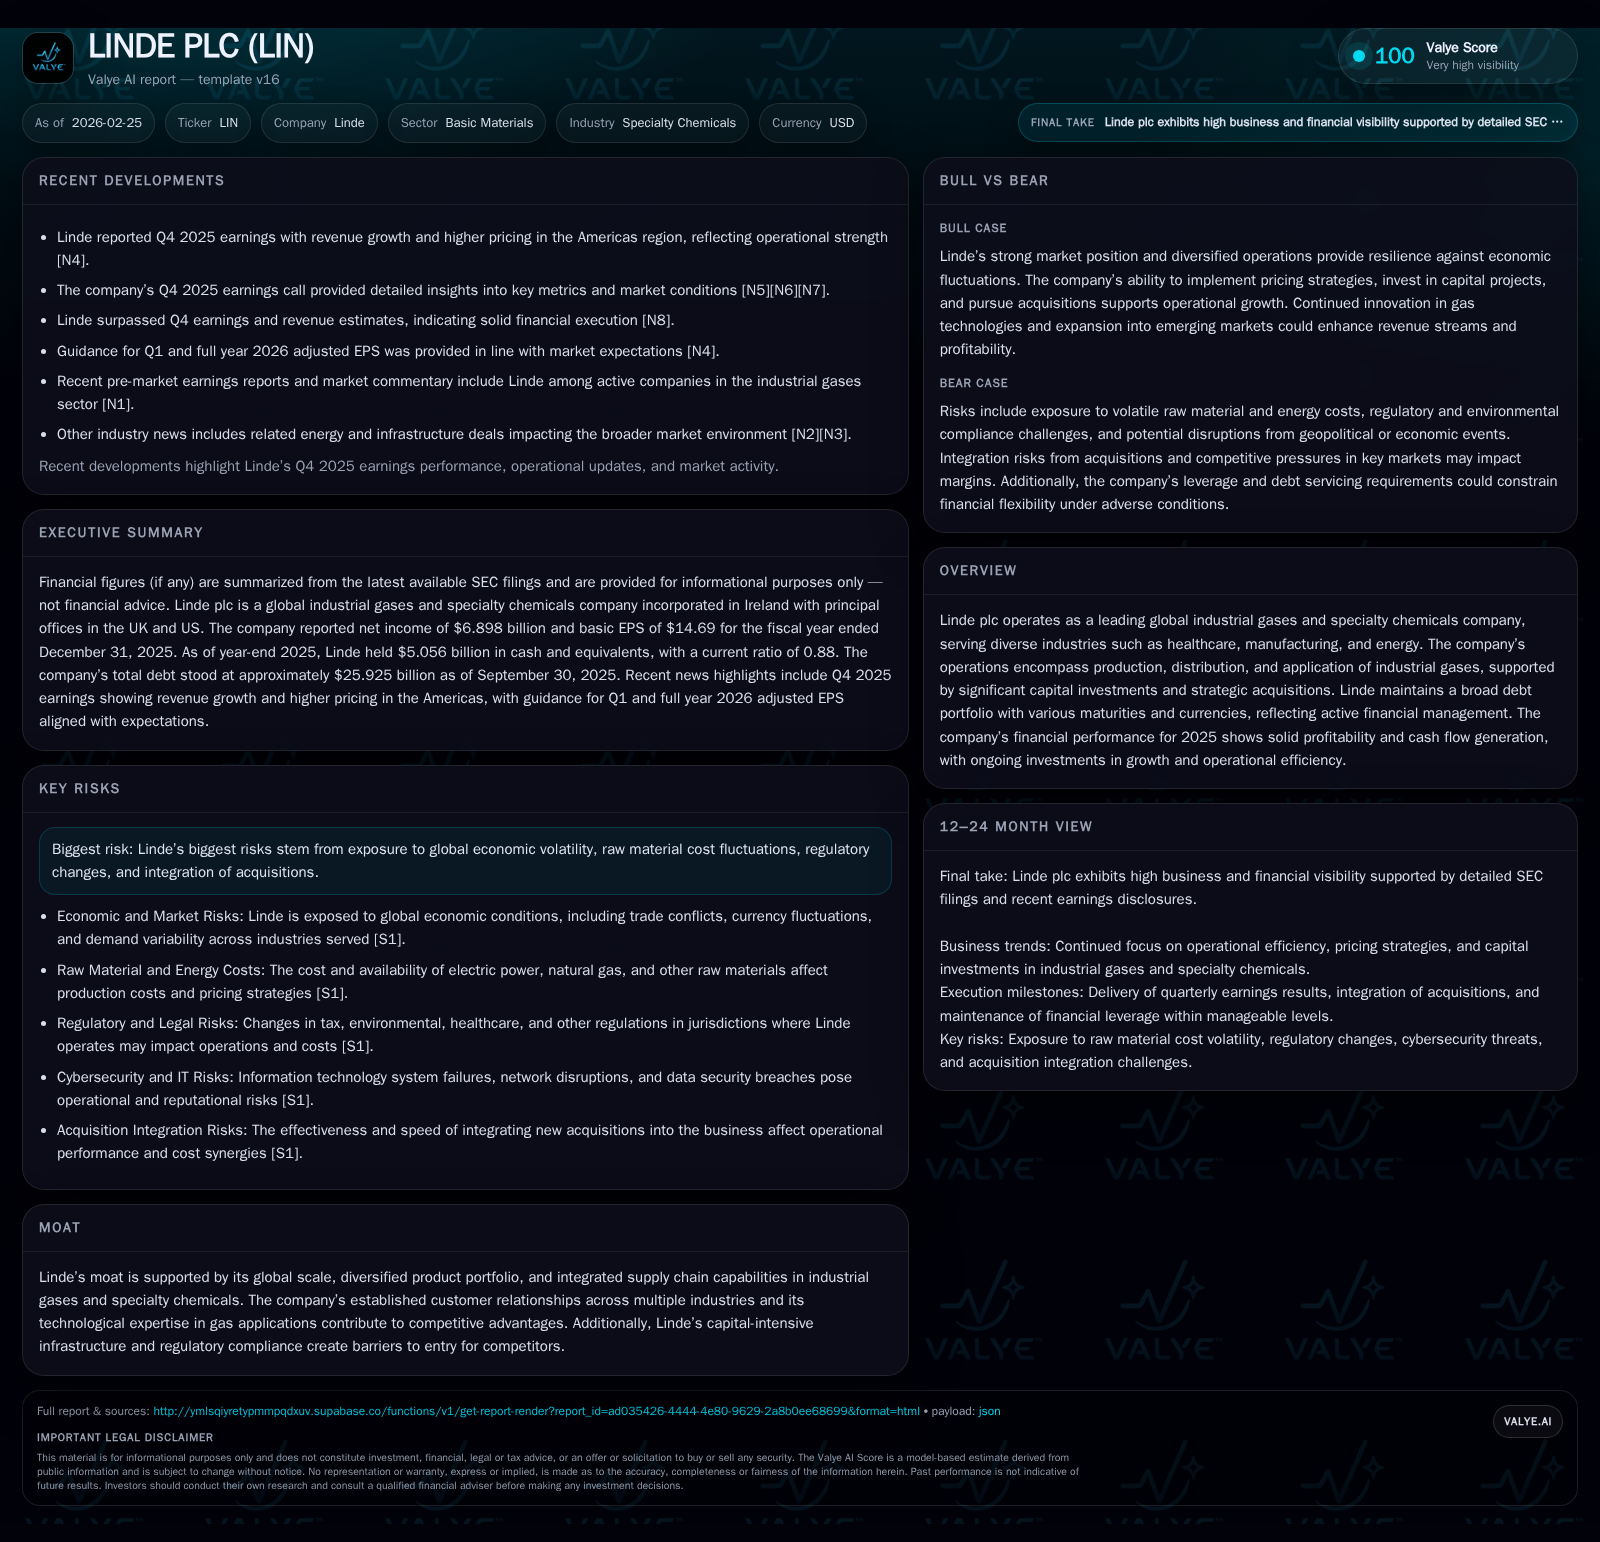
Linde plc demonstrated consistent expansion in operating income and net income from 2022 through 2025, supported by effective pricing strategies and operational efficiencies. The company’s capital expenditure rose significantly over the period, underpinning capacity enhancements aligned with rising demand in key sectors such as healthcare and energy. Linde maintains a disciplined balance sheet despite a current ratio below unity, reflecting leverage for growth investments while returning significant cash to shareholders through dividends and buybacks. Key growth drivers include product diversification and advanced application expertise, though risks from raw material costs and regulatory changes remain notable.
Historical Performance: Sustaining Growth Momentum in Industrial Gases
Linde plc’s financial trajectory from fiscal year (FY) 2022 through FY 2025 illustrates sustained growth across its key profit metrics. Operating income surged from $5.37 billion in 2022 to $8.92 billion in 2025—a compound annual growth rate (CAGR) exceeding 18%. Net income followed a parallel path, rising to approximately $6.90 billion by the end of 2025 with a moderate year-over-year (YoY) increase of around 5.1% for the latest fiscal year [F1]. Operating cash flow showed resilience with near-double digit YoY gains culminating at $10.35 billion in FY25.
Capital expenditure (capex) ramped up by roughly 17% YoY reaching $5.26 billion in FY25 compared to $3.17 billion in FY22, reflecting strategic investments into production facilities that cater to growing demand for industrial and specialty gases [F1]. These trends embody Linde’s operational momentum, generating ample cash flows that support both reinvestment and shareholder distributions.
Historical performance (annual)
| FY | Net ($bn) | CFO ($bn) | OpInc ($bn) | Capex ($bn) | Net YoY |
|---|---|---|---|---|---|
| 2025 | 6.9 | 10.3 | 8.9 | 5.3 | +5.1% |
| 2024 | 6.6 | 9.4 | 8.6 | 4.5 | +5.9% |
| 2023 | 6.2 | 9.3 | 8.0 | 3.8 | +49.5% |
| 2022 | 4.1 | 8.9 | 5.4 | 3.2 |
Note: Omitted columns lack sufficient annual XBRL coverage in the provided tags (need ≥2 annual points): Rev. Source: SEC companyfacts cache [F1].
Capital returns and efficiency (annual)
| FY | Div ($bn) | Buybacks ($bn) | FCF ($bn) |
|---|---|---|---|
| 2025 | 2.8 | 4.6 | 5.1 |
| 2024 | 2.7 | 4.5 | 4.9 |
| 2023 | 2.5 | 4.0 | 5.5 |
| 2022 | 2.3 | 5.2 | 5.7 |
Source: SEC companyfacts cache [F1].
Note: Revenue data not available; table omits margins and equity metrics due to insufficient history.
Key Drivers Behind Operating Income and Net Income Expansion
The primary forces behind Linde’s profitability gains are multifaceted but firmly rooted in its pricing power—especially within the Americas segment—as disclosed in recent earnings releases [N4]. Strategic price increases have effectively offset raw material cost hikes, enabling margin preservation despite inflationary pressures on gas production inputs such as natural gas and electricity [S1].
Product mix diversification underpins wider spread exposure across healthcare gases for medical applications, specialty gas blends used in semiconductor manufacturing, and large-scale industrial gas supplies for energy sectors [N4][S4]. This portfolio breadth allows lading scale advantages including logistics efficiencies and integrated supply chain synergies that competitors struggle to replicate.
Cost control measures have further bolstered operating income expansion with SG&A expenses remaining largely stable relative to sales growth—an indication of disciplined expense management noted during recent investor calls [N5]. Moreover, the ability to pass through input cost fluctuations via indexed pricing contracts strengthens Linde's resilience.
Capital Expenditure Trend: Investing in Infrastructure for Future Demand
Capex trends highlight Linde’s commitment to supporting long-term demand growth through infrastructure enhancement and technology upgrades critical for specialized gas delivery platforms [F1][S1]. The increase from $3.17 billion to over $5 billion between FY22-25 reflects expansive projects aimed at scaling production capacity in segments aligned with global megatrends like decarbonization.
Notably, the industrial gases market benefits from emerging verticals such as data center cooling powered by gas turbines—a fast-growing field reinforced by recent deals signaling heightened integration between specialty gases providers and energy infrastructure developers [N1]. Linde’s investment cadence suggests it is positioning itself proactively within these nascent yet capital-intensive arenas.
Operational Efficiency and Cost Management Focus
Despite rapid top-line expansion pressures commonly inflating SG&A spending, Linde has maintained a relatively flat trajectory on administrative costs when viewed against its scale-up efforts [F1][S2]. This is partly attributable to ongoing cost reduction programs targeting process optimization without compromising service quality or safety standards—a critical consideration given the company’s capital-intensive plant operations.
Depreciation and amortization remained steady year-over-year, indicative of well-managed asset utilization without excessive write-downs or impairments [F1]. Such consistency points to effective asset lifecycle management amid volatile demand cycles common in specialty chemicals.
Balance Sheet and Liquidity Assessment: Navigating Debt Profiles
Linde exhibits a robust capital structure characterized by sizable equity standing around $38 billion at FY25 end balanced against current liabilities slightly exceeding current assets—yielding a current ratio near 0.88 [F1][S6][S7]. While this suggests tight short-term liquidity parameters, the firm leverages its access to diverse debt instruments denominated across multiple currencies as part of active financial management strategies.
Interest expenses approximate $190 million quarterly, manageable given strong fixed charge coverage enabled by stable operating profits [S2]. Regulatory frameworks influencing leverage ratios also guide cautious debt issuance without constraining capability to fund ongoing capex programs.
Investor Returns: Dividends and Buybacks Reflect Confidence
Capital allocation policies underscore Linde’s balancing act between reinvestment needs and rewarding shareholders consistent with mature specialty chemical firms’ norms [F1][N4]. Dividend payouts escalated steadily from approximately $2.34 billion in FY22 to about $2.81 billion by FY25.
Simultaneously, share repurchases remain substantial albeit slightly down from the peak of over $5 billion executed in FY22—registering close to $4.6 billion spent on buybacks during FY25 [F1]. This dual approach signals confidence in sustainable cash flows while delivering premium returns enhancing shareholder value metrics such as return on equity (ROE), currently estimated around an attractive ~18% based on net income versus equity levels [F1].
Growth Prospects: Market Opportunities and Potential Headwinds
Linde’s future growth potential ties closely to demand upticks across healthcare expansions—driven by aging populations—and accelerating green energy transitions necessitating low-carbon specialty gases for hydrogen production and carbon capture technologies [N4][S1][S2]. Advanced product application expertise remains a core competitiveness pillar enabling catering to complex customer specifications beyond commodity gas supply.
Nonetheless, macroeconomic volatility remains a headwind especially raw material price inflation which could compress margins if price pass-through mechanisms falter under competitive or contractual constraints [S1]. Additionally, complexities arising from integrating acquired businesses pose operational risks that could temper near-term synergies realization.
Outlook Signals: What to Watch Beyond the Latest Earnings
Monitoring acquisition rollouts will be essential as new assets integrate into Linde’s footprint influencing combined operating leverage dynamics [N12][N13][N14]. Also crucial will be assessing execution speed on upcoming capex projects ensuring timely capacity come-online aligned with market needs without cost overruns.
Tracking pricing momentum particularly in high-growth regions provides insight into sustainable margin trajectories alongside evolving regulatory landscapes potentially impacting cost baselines or accessibility of certain markets.
Wall Street consensus previews projecting continued earnings increases create an expectation baseline but leave room for variability tied directly to macro sensitivities noted earlier [N12].
Strategic Risks: Raw Materials, Regulation, and Acquisition Integration
Key risk exposures stem mainly from raw materials volatility impacting electric power and natural gas pricing vital for industrial gases manufacture—a risk partially mitigated but not eliminated by contractual pass-throughs [S1][S2].
Regulatory shifts introduce compliance costs potentially affecting operational flexibility especially across jurisdictions imposing stringent environmental or safety standards requiring costly adaptations.
Finally, acquisition integrations represent execution risk inherent in expanding scale while preserving cultural alignment and system interoperability—areas management highlights as ongoing priorities within planning frameworks [N5].
This analysis is based solely on publicly available financial disclosures and news reports as of February 25, 2026, without making investment recommendations.
Disclaimer: This is research-only, informational analysis and not investment advice. It may include AI-generated interpretation and general industry context. Always verify important details using primary sources.
Comments