
LIVE VENTURES' Q2 2026 Results Spotlight Liquidity and Portfolio Management Challenges
Latest quarterly filing reveals revenue expansion alongside persistent net losses and liquidity nuances, emphasizing capital management and executive stability.
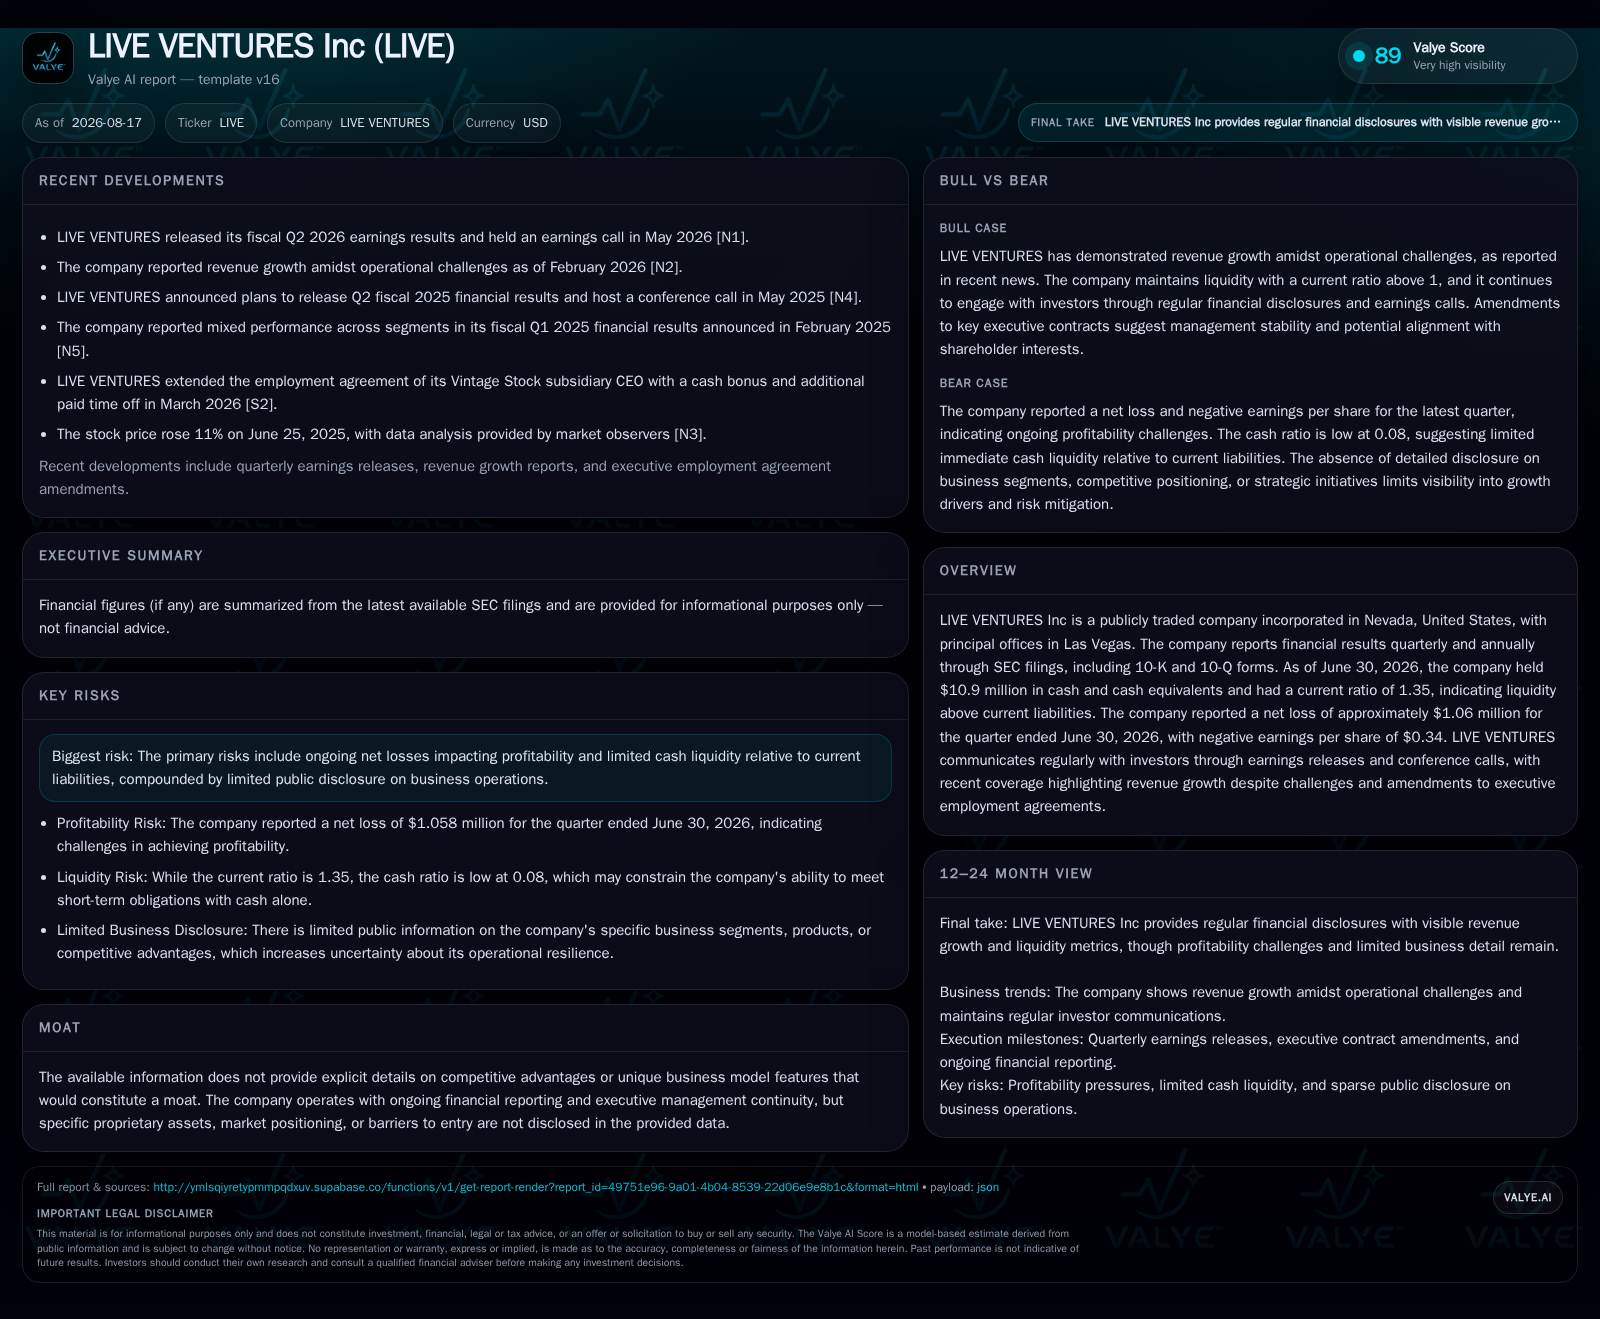
LIVE VENTURES reported a net loss of approximately $1.06 million for Q2 2026 despite evidence of portfolio revenue growth, underscoring the tension between top-line expansion and profitability. The company maintains a positive current ratio of 1.35 with $10.9 million in cash, signaling moderate liquidity yet reflecting operating pressures typical in diversified holdings balancing capital deployment and cash conservation. Governance stability is highlighted by recent amendments to executive employment agreements, but risks remain tied to market volatility, concentration, and limited operational transparency.
Q2 Operating Update: Revenue Gains vs. Loss Persistence
In filings released August 13, 2026, LIVE VENTURES reported a net loss for the second quarter ended June 30 of roughly $1.06 million alongside negative earnings per share of $0.34 [S2][S3]. This juxtaposition between continued top-line momentum—driven by portfolio revenue growth—and persistent profitability challenges reflects the common tension within diversified holding companies navigating cyclical investment returns versus operational expenses. While revenue growth signals improving operating performance among underlying assets or investments, the sustained net loss tempers enthusiasm, warning that margin expansion or cost control remains an unmet target at this stage. Confirmation of a durable turnaround would come through sustained positive earnings or improved operating income figures over subsequent quarters.
Unearthing LIVE’s Revenue Model: Investment Returns Over Operations
LIVE VENTURES functions primarily as a diversified holding entity with revenue streams stemming from various investment returns including dividends, interest income, capital gains on asset sales, and segmented income generated by operating subsidiaries [S1][F1]. Unlike companies that monetize through direct product sales or service contracts, LIVE's revenues are sensitive to portfolio composition shifts driven by acquisitions and divestitures as well as fluctuating market valuations impacting realized gains and dividend yields.
Margins in this model hinge on effective capital deployment—a balance between pursuing accretive acquisitions and preserving liquidity—as well as the operating efficiency of subsidiaries under management. The company’s reported cash balance of $10.9 million suggests some runway for strategic moves but aligns with the modest scale implied by its numbers compared to large peers [F1]. Importantly, LIVE does not disclose detailed segment revenue or profitability breakdowns for subsidiaries, thus limiting direct visibility into which areas drive growth or incur drag.
Industry Context: How LIVE Aligns With Diversified Holdings Peers
Against broader industry parallels such as Berkshire Hathaway and Icahn Enterprises—both established diversified holding companies with extensive scale—LIVE represents a smaller-scale player focusing on diversified asset management through operationally active subsidiaries [S1][F1]. While these peers leverage significant competitive moats via brand strength, diversified equity stakes across multiple sectors, deep capital reserves, and demonstrated ability to generate recurring free cash flow, LIVE’s disclosures reveal none of these attributes explicitly.
Liquidity approaches also differ given peers’ larger balance sheets and access to capital markets offering buffer against volatility. Loews Corporation offers an example of managing liquidity risks within conglomerates by maintaining conservative leverage levels and balanced portfolio exposure; LIVE’s roughly neutral net debt position mirrors this caution but on a substantially different size basis [F1]. The absence of revealed moat-like characteristics suggests LIVE may face greater vulnerability to market downturns or operational disruptions compared with these stalwarts.
Liquidity Snapshot: Current Ratio Strength Hides Underlying Pressures
The company’s June 30 balance sheet shows current assets at approximately $174.4 million against current liabilities near $128.9 million yielding a current ratio of about 1.35 which surpasses the conventional benchmark of liquidity adequacy in short-term obligations coverage [F1]. Cash on hand amounts to $10.9 million while total debt rests low at roughly $800,000 resulting in a negative net debt position approaching -$10.1 million indicating more cash than debt outstanding [F1].
While these figures convey manageable liquidity conditions supportive of ongoing operations or incremental capital deployments, the narrow margin between assets and liabilities signals limited cushion should investment performance deteriorate or unexpected obligations arise. Given the firm’s negative earnings baseline restraining free cash flow generation potential, sustained liquidity management will be critical especially amid fluctuating market dynamics influencing portfolio valuations. Subsequent quarters should be monitored closely for changes in working capital metrics or any non-recurring items impacting cash flows.
Growth Ambitions: The Role of Acquisitions and Portfolio Dynamics
Although detailed disclosures regarding recent acquisitions or divestitures are sparse within live filings up to August 13, the business model inherently prioritizes using capital deployment strategically to drive portfolio revenue growth and diversification benefits [S1][S3]. Commentary accompanying filings suggests executives remain focused on identifying opportunities where operational improvements or asset repositioning can enhance underlying value.
Growth thus depends heavily on disciplined deal sourcing coupled with integration effectiveness—norms observed broadly in private equity firms where returns hinge not only on price paid but post-acquisition value creation activities. For LIVE VENTURES lacking scale advantages seen in larger fund managers or holding companies, focusing on niche segments or specialty operators might be necessary for differentiation but absent clear evidence remains speculative at this stage.
Key Risks: Market Volatility, Concentration Risk, and Transparency Challenges
Risk factors emphasized in recent SEC disclosures reinforce several vulnerabilities typical for diversified holdings such as exposure to portfolio valuation swings driven by market volatility which can rapidly erode net asset value impacting reported results and investor confidence [S11][S16][S17]. Liquidity constraints emerging from negative net income trends pose additional stress on operational agility while concentrated ownership stakes may exacerbate risk case if particular subsidiaries underperform.
Moreover, limited transparency into subsidiary-level operations could hinder investor assessment capabilities thereby increasing perceived uncertainty around financial stability or growth prospects—a noteworthy challenge for public market participants evaluating governance practices alongside financial metrics.
Investor Signals: What To Watch For in Upcoming Filings
Critical markers to observe in subsequent reporting periods include sustained portfolio revenue growth trends confirming initial momentum beyond one-off effects; enhanced disclosure about operating income contributions from key subsidiaries which would clarify core profit drivers; changes in cash burn trajectory signaling improved cash conversion efficiency; as well as any amendments to executive employment agreements that could indicate shifts in leadership stability impacting strategic continuity [S3][S7]
Regular communication cadence through earnings releases and conference calls will be vital for investors seeking clarity on execution progress amid an otherwise opaque business landscape.
Financial Profile Discussion: A Quick Look at Cash Position and Leverage
As of June 30, 2026, LIVE VENTURES held approximately $10.9 million in cash and equivalents against a backdrop of total debt near $800,000 culminating in a modestly negative net debt posture (-$10.1 million), while reporting current assets totaling roughly $174 million compared to current liabilities close to $129 million reflected by a current ratio of 1.35 [F1]. This scenario suggests moderate liquidity supportive of near-term obligations but highlights tight balances typical for companies still grappling with profitability challenges.
The prevailing net loss environment constrains free cash flow generation capacity thereby placing high importance on careful liquidity management paired with prudent capital allocation decisions—balancing funding new investments against preserving cash buffers to avoid undue financing risks going forward [S2][F1]
This analysis synthesizes publicly disclosed information without offering investment advice. It focuses on operational context, industry alignment, financial health indicators, governance considerations, risk factors typical for diversified holding companies like LIVE VENTURES Inc., based strictly on available SEC filings through August 13, 2026.
Disclaimer: This is research-only, informational analysis and not investment advice. It may include AI-generated interpretation and general industry context. Always verify important details using primary sources.

Comments