
Live Oak Bancshares’ Shift from Rapid Growth to Capital Discipline under SBA Lending Focus
Following years of asset and profit expansion, Live Oak Bancshares demonstrates stabilizing profitability and tighter capital management amid regulatory demands.
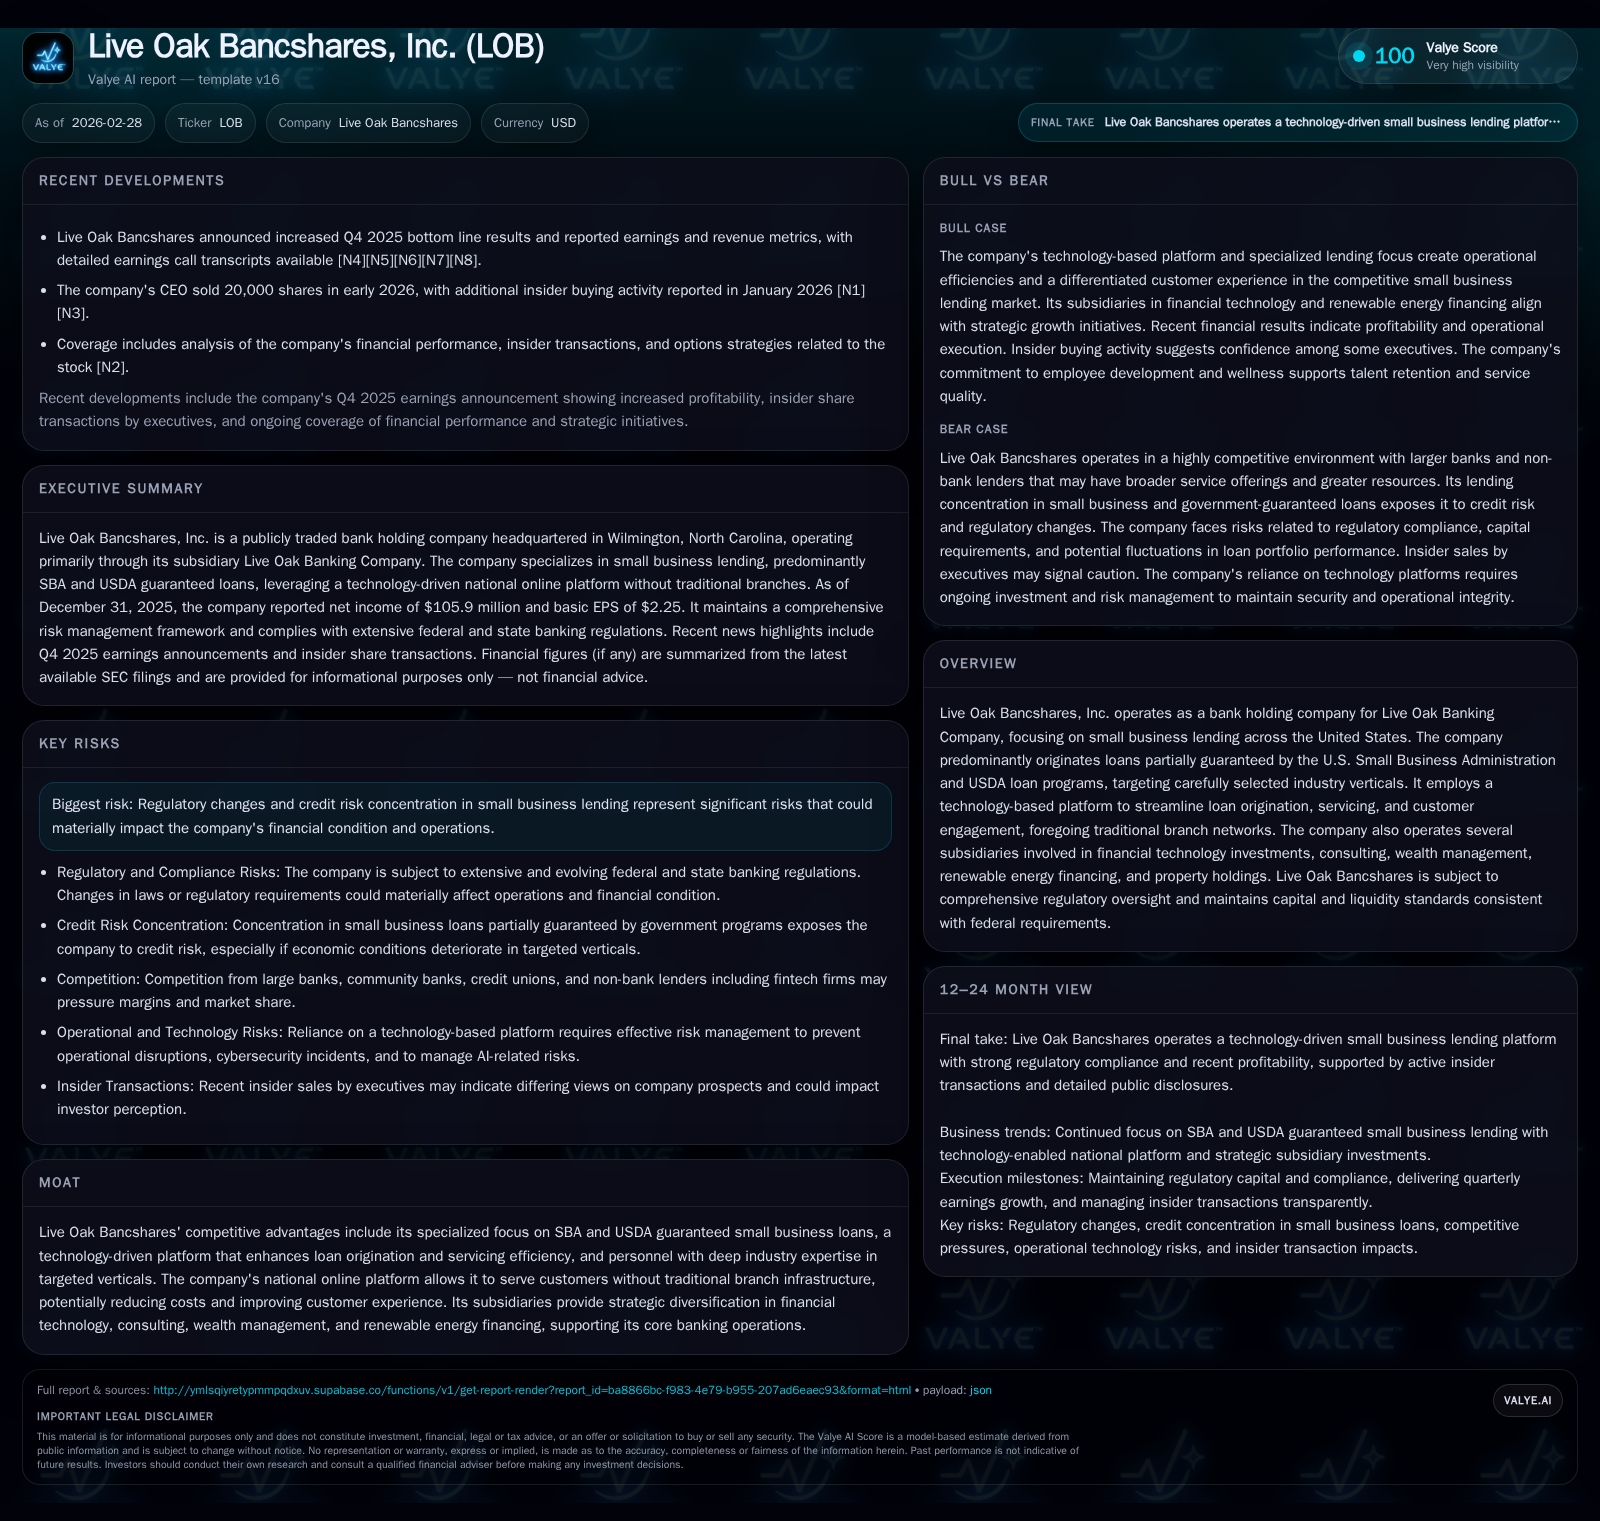
Live Oak Bancshares, Inc. has built a distinctive banking franchise centered on SBA and USDA-guaranteed small business loans, leveraging a tech-driven platform in lieu of traditional branches. The company experienced variable net income over recent years, with a notable rebound in 2025 after a decline in 2022. Operating cash flows remain strong while capital expenditures have dropped sharply, signaling a shift toward operational efficiency and capital discipline. Regulatory capital requirements tightened as total assets surpassed $10 billion, imposing additional compliance costs. Future growth prospects are linked to SBA lending reforms, credit performance in chosen industry verticals, and technology enhancements. Shareholders should monitor loan portfolio quality and regulatory developments closely.
Company Overview
Live Oak Bancshares, Inc., headquartered in Wilmington, North Carolina, is the bank holding company for Live Oak Banking Company. The Bank operates nationally via an established online platform primarily focused on small business lending backed by U.S. government guarantees — notably SBA and USDA programs [S1]. Founded in 2008 and publicly listed on the NYSE since 2015 under ticker LOB, the company eschews traditional branch networks to enhance efficiency through technology-enabled loan origination, servicing, and customer engagement [S1].
This innovative model supports their target vertical approach where lending personnel develop deep industry expertise paired with virtual client relationships to create personalized experiences at scale.
Complementing core lending activities, Live Oak Bancshares holds subsidiaries engaged in financial technology investments (Live Oak Ventures), consulting services, wealth management through regulated advisers, renewable energy project financing aligned with national policy priorities, and real estate holdings around its corporate headquarters [S8].
Historical Financial Performance
Live Oak’s financial trajectory reveals significant volatility reflecting the cyclical nature of small business lending portfolio performance combined with evolving economic conditions impacting borrower creditworthiness.
Historical performance (annual)
| FY | Net ($mm) | CFO ($mm) | Capex ($mm) | Net YoY |
|---|---|---|---|---|
| 2025 | 106 | 158 | 15 | +36.7% |
| 2024 | 77 | 146 | 49 | +4.8% |
| 2023 | 74 | 620 | 47 | -58.1% |
| 2022 | 176 | 124 | 44 |
Source: SEC companyfacts cache [F1].
Capital returns and efficiency (annual)
| FY | Div ($mm) | FCF ($mm) | ROE% |
|---|---|---|---|
| 2025 | 143 | 8.5 | |
| 2024 | 5 | 96 | 7.8 |
| 2023 | 5 | 573 | 8.2 |
| 2022 | 5 | 81 | 21.7 |
Source: SEC companyfacts cache [F1].
(Source: [F1])
Net income dipped significantly from its peak of $176 million in FY2022 to $74 million in FY2023 before rebounding strongly by over one-third in FY2025 to nearly $106 million — this reflects a moderation following a surge year likely influenced by loan sale gains or transient credit factors [F1]. Operating cash flow similarly spiked in FY2023 but normalized thereafter; importantly capital expenditures contracted drastically starting FY2024 signaling an operational pivot from investment-intensive growth modes toward tighter expenditure control.
Equity grew steadily over these years consistent with retained earnings accumulation tempered by dividend distributions that remain modest relative to earnings — dividends saw small increases year-over-year within a low payout framework [F1][S19].
Business Model Nuances & Moat
Live Oak distinguishes itself by focusing on lower-risk segments within small business lending largely supported through partial government guarantees such as SBA's Preferred Lender Program and USDA initiatives including REAP and WEP loans targeting rural energy projects [S1][S8]. This concentration enables risk control through government-shared credit exposures but also ties profitability tightly to federal program continuity.
Its technology-driven online platform facilitates rapid proposal generation and credit decisioning across a national footprint without costly branch infrastructure—a key efficiency driver reducing operating expenses compared to branch-heavy peers [S8]. Personnel depth gained from vertical specialization further bolsters underwriting quality and customer relationships.
Subsidiaries expand strategic reach—especially investments in fintech firms via Live Oak Ventures offering potential upsides beyond core banking income streams while wealth management and renewable energy lend diversification both financially and operationally.
Regulatory & Capital Constraints
Having crossed the $10 billion total asset threshold recently (FY2023), Live Oak faces elevated regulatory regimes under Dodd-Frank Act provisions implemented by the Federal Reserve including more frequent examinations, larger deposit insurance assessments calculated by "large bank pricing," establishment of a Board risk committee and heightened compliance expectations resulting in increased operating costs [S26][S4][S6].
At December 31, 2025 the company maintained solid capital ratios well above regulatory minima e.g. common equity Tier 1 ratio of roughly 10.53%, Tier 1 ratio just above 11%, and leverage ratio near double the minimum at ~8.48%, positioning it as "well capitalized" per FDIC standards [S4][S9].
Nonetheless stringent regulations limit capital deployment flexibility—including dividend payments tied to capital adequacy assessments and Federal Reserve pre-approval requirements for share buybacks—complicated further by new excise taxes imposed on repurchases per Inflation Reduction Act rules effective post-December 31, 2022 [S5].
Credit Risk & SBA Program Dependence
Credit losses remain a focal risk area given portfolio concentration within small businesses—segments generally more vulnerable economically than larger corporates—and dependence on collateral recovery affected by local real estate market dynamics [S11][S18]. Loan delinquencies or increased charge-offs would materially affect earnings given lower diversification opportunities relative to much larger institutions.
Furthermore, the company's status as an SBA Preferred Lender permits expedited access for clients but necessitates ongoing rigorous compliance with SBA policies; loss of this designation or adverse federal program modifications could curtail origination volumes or increase operational complexity substantially [S11][S18].
Automation incorporating AI algorithms enhances underwriting speed but introduces model risk which management acknowledges as an emergent operational challenge requiring sustained governance oversight [S1].
Future Growth Prospects & Catalysts
Growth avenues hinge on multiple moving parts including:
- Renewal or enhancement of SBA Preferred Lender status enabling continued direct pipeline access.
- Expansion within USDA's rural-focused loan product suite aligned with government emphasis on green energy facilitation.
- Continuous platform innovation improving user experience while reducing per-loan costs.
- Selective vertical expansion balanced against credit risk tolerance frameworks.
- Subsidiary investments maturing into additional revenue sources beyond interest income.
Constraints on growth arise from regulatory overhead scaling with asset growth beyond $10B threshold causing diminishing returns on incremental scale without clear operational leverage gains [N1][N2][S26]. The competitive landscape includes major banks servicing small business markets alongside fintech entrants deploying alternative underwriting models not burdened by similar regulation—although Live Oak’s niche specialization may provide defensible positioning versus broader competitors [S8].
Forecasts & Guidance Observations
Public disclosures lack formal forward financial guidance; however recent commentary highlights priorities on sustaining credit quality amidst macroeconomic uncertainties and prudently managing capital returns through dividends while evaluating buyback opportunities cautiously given regulatory cost structures [N1][N3][S3]. Monitoring quarterly delinquencies alongside volume shifts within SBA-backed loans will be key early indicators of trajectory shifts.
Capital Allocation & Returns Metrics
Approximately calculated return on equity based on FY2025 net income over FY2025 equity was about 8.5%, reflecting moderate profitability aligned with a regulated bank balancing growth versus risk controls [F1]. Free cash flow remains robust at approximately $143 million due to high operating cash flow offsetting sharply lower capex spending indicating better cash generation efficiency (details above).
Dividend payments so far show conservative payout relative to earnings maintaining retainment capacity for organic growth or buffer buildup against credit shocks; no large-scale share repurchases have been reported recently due partly to prudential reserves mandated by regulators [S19][N6][N8].
Competitive Position & Industry Context Analysis
Within the highly competitive small business banking sector characterized by legacy players with branch-intensive models alongside nimble fintechs leveraging data analytics and marketplace platforms, Live Oak’s distinct combination of vertical expertise blended with tech-driven execution grants niche advantages around speed-to-decision times and customer intimacy absent branch dependency costs [S8]. Their reliance on government program guarantees is a double-edged sword—reducing risk exposure but concentrating earnings vulnerability against policy shifts.
Newer entrants increasingly employ AI-driven credit assessment tools aggressively priced but often lacking comprehensive underwriting depth found at Live Oak which may temper near-term disruption effects but will require continuous innovation investment.
Risks Summary Reminder
Among material risks cited are:
- Increased loan delinquencies impacting allowance adequacy,
- Potential structural changes or loss of eligibility under SBA/USDA programs,
- Heightened regulatory cost burdens tightening capital deployment,
- Technology risks including AI model misperformance or cybersecurity incidents,
- Macroeconomic shocks affecting small business segments disproportionately,
- Concentrated lender exposure relative to general commercial banking peers,
- Litigation or enforcement arising from compliance gaps,
- Challenges posed by evolving privacy/data security regulations imposing operating constraints. These require ongoing vigilant management attention given their potential sizable impact on operations or valuation assumptions [S15][S16][S26].
This analysis synthesizes publicly available SEC filings up through February 27, 2026 ([F1],[S1]-[S29]) supplemented by recent earnings call transcripts ([N1]-[N9]). It reflects data explicitly disclosed without extrapolation or forecast modeling beyond documented guidance or corporate commentary provided therein.
It is designed solely for informational purposes as an internal exam paper consistent with Valye News policy guidelines—no investment recommendations are offered or implied herein.
Disclaimer: This is research-only, informational analysis and not investment advice. It may include AI-generated interpretation and general industry context. Always verify important details using primary sources.
Comments