
Marcus Corp’s Crossroads: From Theatrical Volatility to Hospitality Stability
Marcus Corporation balances unpredictable theatre revenue cycles with steady hospitality income amid tariff-driven cost pressures.
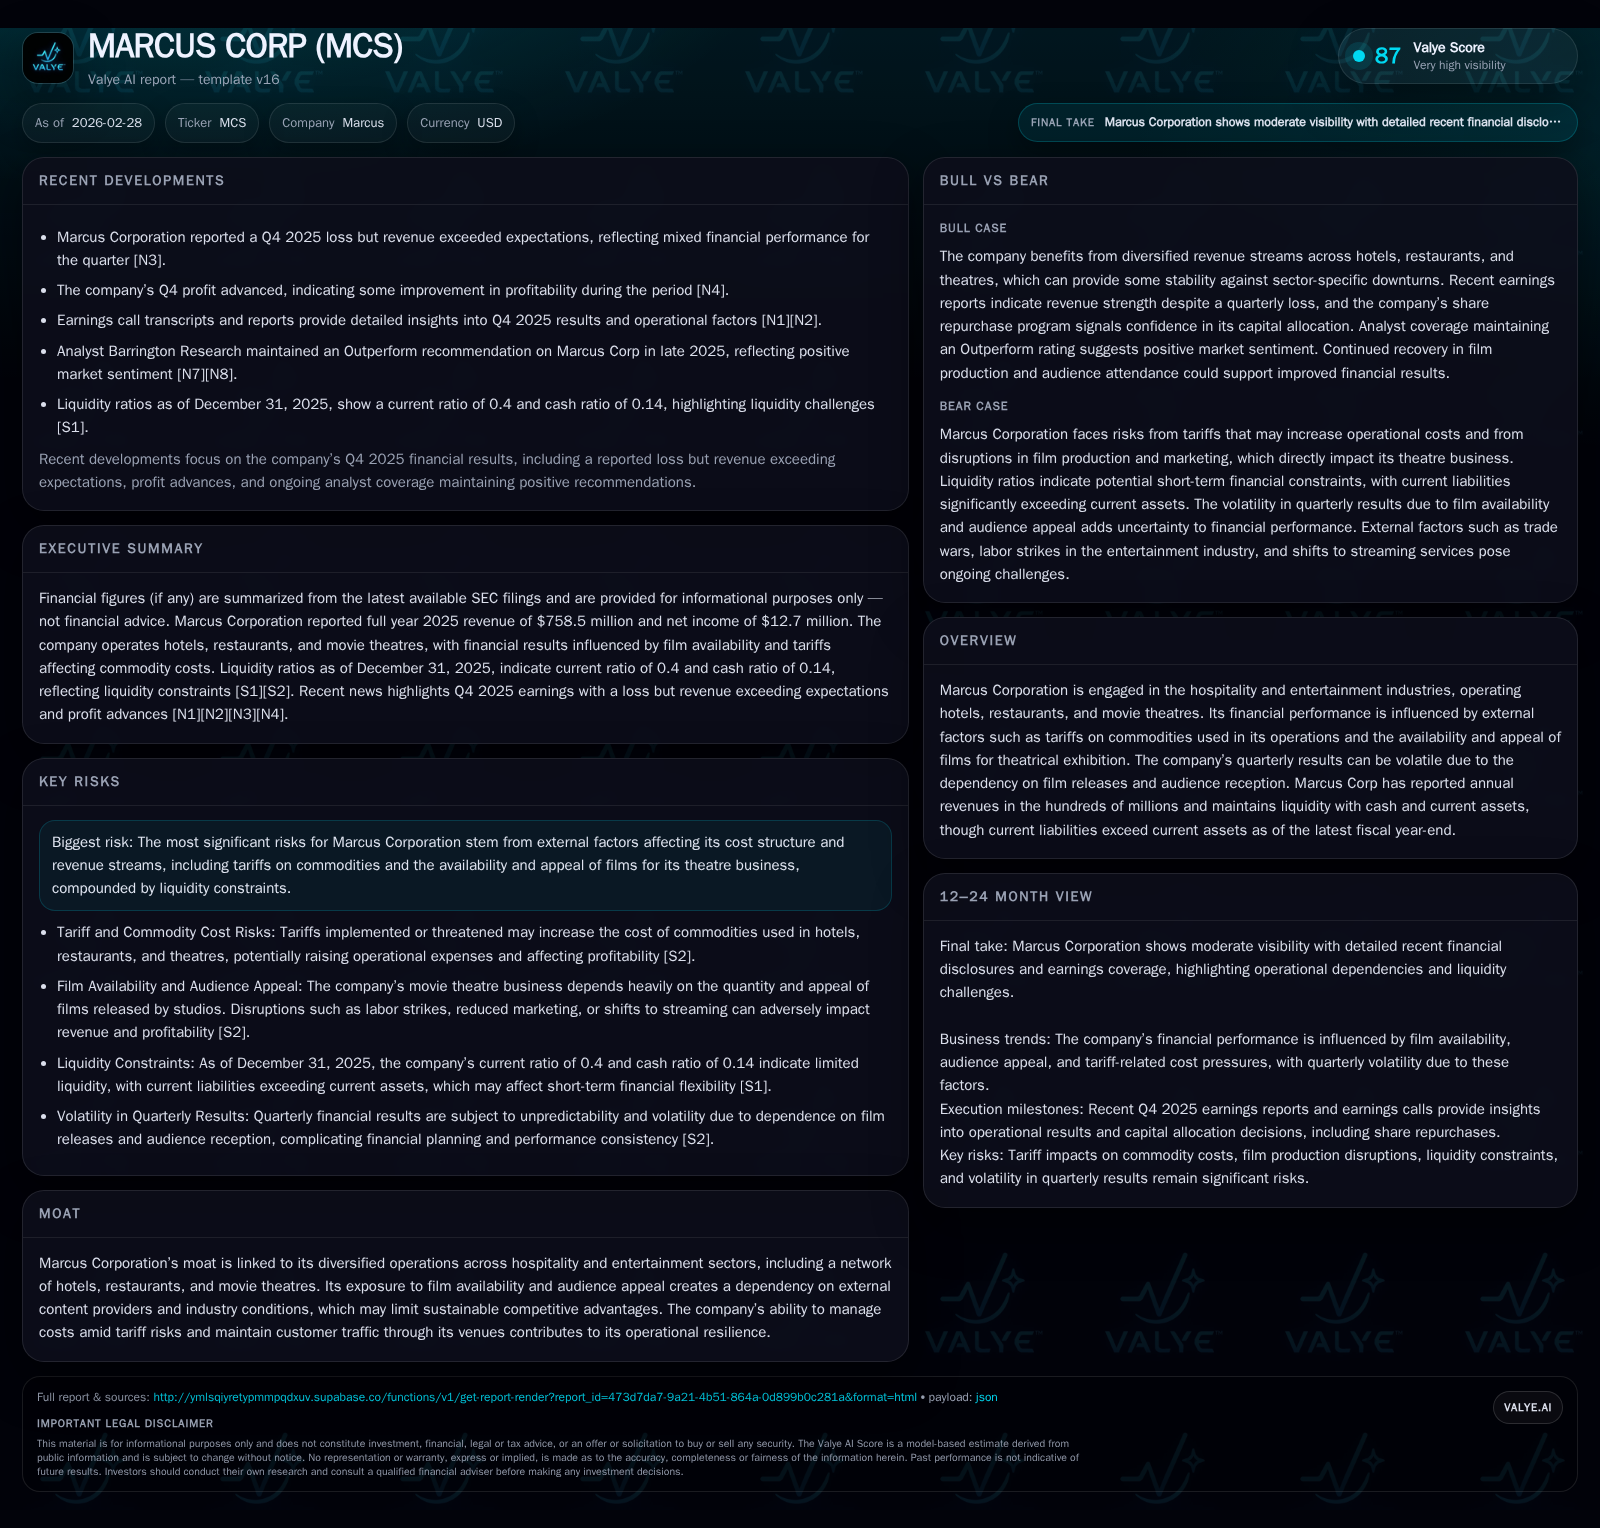
Marcus Corporation operates at the intersection of two contrasting business segments: the film exhibition sector, characterized by volatile quarterly results tied closely to film availability and audience reception, and the hospitality segment that delivers steadier revenue through hotels and restaurants. Recent years have seen modest top-line growth fueled by hospitality resilience while theatre revenues discount the lingering effects of disrupted content pipelines and labor strikes. Cost inflation driven by tariffs on commodities critical to operations challenges pricing power, compressing margins. Despite these headwinds, Q4 2025 showed profit gains supported by robust operating cash flow. Liquidity remains pressured by a current ratio below one, but ongoing capital expenditures focus on venue modernization. Forward-looking risks center on continued film supply constraints, evolving viewer preferences, and tariff uncertainties.
Dual-Sector Performance: Hospitality Fuels Steady Revenue While Theatre Faces Content-Dependent Fluctuations
Marcus Corporation operates two main segments with distinct revenue dynamics: hospitality (hotels and restaurants) provides a stable revenue base with consistent growth while its movie theatre segment is subject to significant volatility tied to film release schedules and audience reception [S6][S12][N1]. Pandemic disruptions and labor strikes notably constrained theatrical film availability during fiscal years 2023 and 2024, impacting box office performance [S13].
From FY2022 to FY2025, Marcus’s total revenue increased from approximately $677 million to $758 million — a 3.1% rise in the latest year — primarily supported by hospitality gains offsetting erratic theatre revenues [F1]. This dual-segment exposure results in uneven quarterly earnings driven largely by theatrical content cycles.
Cost Dynamics Amid Tariffs: Margin Pressure Across Operations
Tariffs on key commodities used in Marcus’s hotels, restaurants, theatres, and film production inputs represent an ongoing cost challenge [S10][S12]. While management monitors these risks closely, their ability to raise room rates or ticket prices is limited by customer sensitivity, constraining margin expansion despite steady revenues [S2]. Such cost pressures contribute to operating income margin compression.
Q4 2025 Results Snapshot: Profit Gains Despite Revenue Volatility
Q4 2025 results showed net income improvement even as theatre losses persisted and revenues exceeded estimates [N1][N3][N6]. This reflects effective cost management alongside steady hospitality demand but highlights the entertainment segment’s vulnerability to film supply timing.
Liquidity and Capital Structure: Working Capital Deficit Offset by Cash and Credit Facilities
At fiscal year-end 2025, Marcus reported current liabilities of $163 million versus current assets of $65 million, producing a current ratio near 0.4 indicative of short-term liquidity strain [F1]. This is partly mitigated by cash reserves of approximately $23 million and access to credit lines detailed in recent SEC filings [S7][S8][S9]. Robust operating cash flow of $84 million supports liquidity despite a near 19% decline from the prior year.
Capital Allocation: Focus on Dividends and Capex Over Buybacks
The company’s capital return strategy emphasizes dividend growth over share repurchases since FY2015 [F1][S15][S19][S20]. Dividends rose steadily from about $3 million in FY2022 to $9.2 million in FY2025. Meanwhile, buybacks have been minimal or absent recently as cash is prioritized for capital expenditures totaling $83 million in FY2025—reflecting ongoing investments in venue modernization critical for competitiveness.
Historical Financial Summary
Historical performance (annual)
| FY | Rev ($mm) | Net ($mm) | CFO ($mm) | OpInc ($mm) | Rev YoY | Net YoY |
|---|---|---|---|---|---|---|
| 2025 | 758 | 13 | 84 | 17 | +3.1% | +263.0% |
| 2024 | 736 | -8 | 104 | 16 | +0.8% | -152.6% |
| 2023 | 730 | 15 | 103 | 34 | +7.7% | +223.6% |
| 2022 | 677 | -12 | 93 | 8 |
Source: SEC companyfacts cache [F1].
Capital returns and efficiency (annual)
| FY | Div ($mm) | FCF ($mm) | ROE% |
|---|---|---|---|
| 2025 | 9 | 1 | 2.8 |
| 2024 | 9 | 25 | -1.7 |
| 2023 | 7 | 64 | 3.1 |
| 2022 | 3 | 56 | -2.6 |
Source: SEC companyfacts cache [F1].
Note: All figures rounded; Capex jump from FY2023 to FY2024 reflects stepped-up investment initiatives while operating cash flow fluctuates with theatrical cycles.
Future Outlook: Navigating Film Supply Constraints and Tariff Risks
Key risks include continued disruption of theatrical film supply due to production shutdowns and labor disputes alongside structural shifts toward streaming reducing theatrical windows [S12][S13][N4]. Tariff-driven input cost inflation also threatens margins if pricing power remains constrained [S10][S12]. However, potential easing of trade tensions coupled with recovery in consumer leisure spending could provide upside.
What Investors Should Monitor
- Major blockbuster release schedules influencing quarterly earnings volatility [N2]
- Trade policy developments affecting tariffs on critical commodities [S10]
- Seasonal tourism trends impacting hotel occupancy and restaurant traffic supporting stable revenue base
This analysis synthesizes disclosed data without conjecture regarding unannounced plans or speculative outcomes. Marcus Corporation faces external dependencies that reduce predictability within its entertainment segment while its hospitality division underpins overall performance heading into fiscal year 2026.
Disclaimer: This is research-only, informational analysis and not investment advice. It may include AI-generated interpretation and general industry context. Always verify important details using primary sources.

Comments