
Peapack Gladstone’s Private Banking Gains and Financial Discipline Power 2025 Growth
Peapack Gladstone leverages its boutique private banking approach and focused capital allocation to drive significant growth in a competitive metropolitan market.
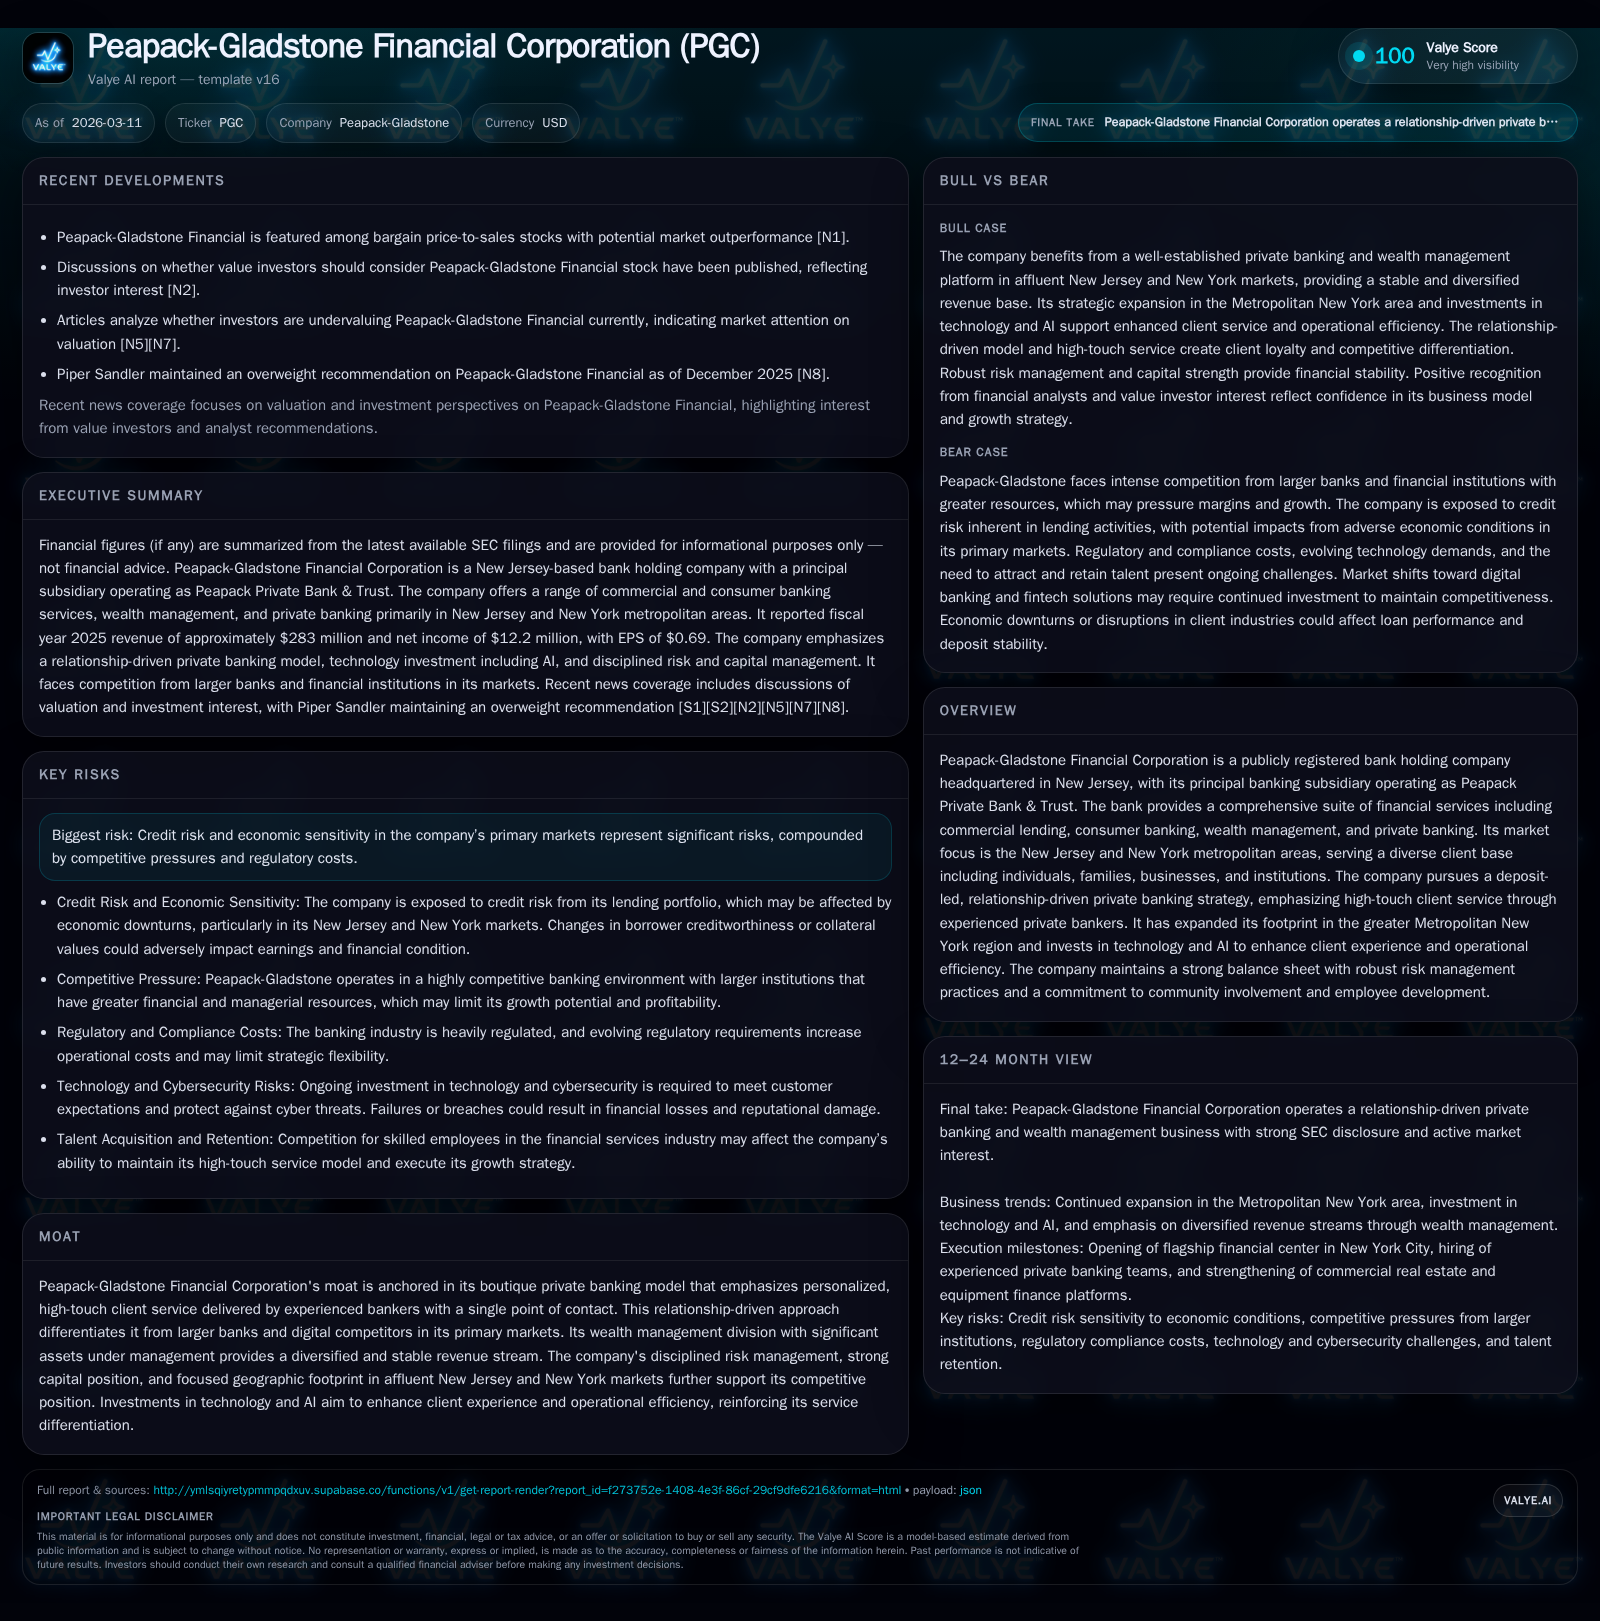
Peapack Gladstone Financial Corporation recorded a notable 24.1% revenue increase and a 31.6% rise in net income in 2025, underpinned by its relationship-driven private banking and wealth management expansion in the New Jersey and New York metro areas. Despite compressions in operating cash flow due to stepped-up investments, particularly in technology and branch development, the company maintains disciplined capital deployment balancing dividends, share buybacks, and capex. Challenges remain from evolving credit risks and regulatory costs, but the firm’s strong balance sheet and technological modernization efforts aim to sustain client service differentiation and financial resilience.
Historical Revenue and Profit Momentum: Exploring 2023-2025 Trends
Peapack Gladstone Financial Corporation’s financial trajectory over the past three years shows clear evidence of accelerating top-line growth culminating in a sharp jump in 2025. Annual revenue surged 24.1% year-over-year to $282.995 million in fiscal year 2025, up from $228.128 million the prior year, reversing a mild dip from $242.497 million in 2022 to $229.667 million in 2023 [F1]. This growth was mirrored by an impressive net income increase of 31.6%, rising to approximately $12.16 million from nearly $9.24 million.
Operating cash flow (CFO), however, declined substantially by roughly 39.3% to $43.13 million in 2025 from $71.10 million the year before [F1]. This contraction coincides with a strategic rise in capital expenditures to $14.32 million (+76.8%), indicating a deliberate push towards long-term investments such as technology upgrades and branch enhancements aimed at supporting future growth.
The company’s equity base expanded steadily across this period—from $532.98 million at the end of 2022 reaching $658.21 million by end-2025—buffering its operations for continued organic expansion initiatives and absorbing credit provisioning impacts while maintaining regulatory capital compliance [F1]. Dividend distributions held relatively stable around mid-$3 million levels annually since 2022, while share repurchases slowed significantly from peak activity levels seen earlier within this timeframe, reflecting calibrated capital deployment aligned with reinvestment priorities.
Historical performance (annual)
| FY | Rev ($mm) | Net ($mm) | CFO ($mm) | Capex ($mm) | Rev YoY | Net YoY |
|---|---|---|---|---|---|---|
| 2025 | 283 | 12 | 43 | 14 | +24.1% | +31.6% |
| 2024 | 228 | 9 | 71 | 8 | -0.7% | +7.5% |
| 2023 | 230 | 9 | 70 | 3 | -5.3% | -58.2% |
| 2022 | 242 | 21 | 119 | 4 |
Source: SEC companyfacts cache [F1].
Capital returns and efficiency (annual)
| FY | Div ($mm) | Buybacks ($mm) | FCF ($mm) |
|---|---|---|---|
| 2025 | 4 | 5 | 29 |
| 2024 | 4 | 7 | 63 |
| 2023 | 4 | 12 | 67 |
| 2022 | 4 | 33 | 115 |
Source: SEC companyfacts cache [F1].
Table: Peapack Gladstone Annual Historical Financials (FY2022-FY2025); USD figures expressed in millions except where indicated.
Drivers Behind Growth: Relationship-Led Private Banking and Wealth Management Expansion
Central to Peapack Gladstone’s resurgence is its entrenched boutique private banking model that emphasizes personalized, relationship-driven service executed by seasoned bankers acting as single points of contact for clients [S1]. This hands-on approach differentiates it meaningfully against larger regional competitors and digital-first fintech entrants that often struggle with retention of ultra-high-net-worth clientele seeking bespoke financial solutions.
The bank’s wealth management segment plays an instrumental role supplying a stable revenue stream derived from sizeable assets under management concentrated predominantly within affluent New Jersey and Greater New York markets [N4], [S1]. This geographic focus leverages regional demographics characterized by high average household wealth levels, ensuring consistent demand for trust administration, tax advisory services, investment management, and comprehensive private banking products.
Relationship-based customer acquisition continues to underpin commercial loan growth—offering lines of credit, term financing for fixed assets, multifamily mortgages and other asset-backed structures tuned closely to operating companies’ cash flow profiles underpinned by robust underwriting standards tailored to local market characteristics [S12].
Emerging Challenges: Competitive Pressures and Regional Economic Sensitivities
Despite these positives, Peapack Gladstone faces headwinds primarily stemming from elevated credit risk concerns tied to seasonal economic cycles within its core NJ/NY footprint as well as intensifying competition driving margin pressures—the latter exacerbated by compliance costs imposed through evolving regulatory frameworks including Basel III requirements and consumer protection statutes implemented post-financial crisis reforms [S1].
The region’s economic vulnerability—including potential recessionary contractions—is flagged explicitly by company leadership as a medium-term concern capable of adversely affecting loan demand patterns alongside asset quality metrics such as nonperforming loans migration rates [S1]. Operationally, the company must also contend with challenges adapting efficiently to rapid technological changes necessitated by client expectations for digital convenience paired with boutique-level service—a balance requiring sustained investment.
Investments in Technology and AI to Enhance Client Experience
To fortify its competitive moat while scaling service delivery sustainably, Peapack Gladstone has underscored investments into technology infrastructure including artificial intelligence integrations designed not only to streamline back-office efficiency but also personalize client interactions via data analytics insights—aiming for elevated engagement without eroding the relationship intimacy core to its offering [S1].
These initiatives are part of broader modernization efforts that include branch remodeling across strategically important locations within Somerset County and select New York City sites reinforcing the company’s presence while facilitating hybrid relationship dynamics combining digital access with high-touch advisory support.
Outlook and Catalysts: Growth Prospects in Metropolitan NJ & NY Markets
Looking forward, analysts who recently upgraded Peapack Gladstone emphasize monitoring its ability to deepen market penetration particularly into densely populated regions like Long Island and Manhattan where wealth accumulation remains robust despite macroeconomic uncertainties [N4]. Growth catalysts also hinge on successful integration of acquired wealth management teams enhancing cross-selling opportunities.
Margin trends will be sensitive to interest rate developments affecting net interest margin as substantial portions of the loan portfolio reprice rapidly within short timeframes—roughly half repricing within one year—and deposit mix evolution reducing higher-cost funding reliance remains essential for profitability preservation [S10]. Credit performance will require vigilant observation given recent upticks in specific reserves reflecting nuanced borrower credit quality shifts.
Capital Allocation Priorities: Balancing Dividends, Buybacks, and Capex Spending
Capital discipline features prominently within management communications highlighting consistent dividend payouts around low-$3 million annually alongside tempered share repurchase activity that contracted from over $32 million buybacks during FY22 down sharply to about $5 million by FY25 evidencing prudent allocation amid heightened capex demands supporting technology upgrades [F1], [S15].
Liquidity robustness underpins this capital flexibility with substantial available external borrowing lines amounting to approximately $3.63 billion combined with ample securities collateral enabling opportunistic funding capacity if required for inorganic or organic initiatives [S4], [S5], [S10].
Performance Metrics: Return on Equity and Cash Flow Dynamics
Peapack Gladstone registered an approximate return on equity near 1.8% based on FY25 net income relative to equity base values [F1], reflecting moderate profitability constrained partly by credit loss provisioning impacts within earnings quality dynamics [S9]. While revenue growth accelerated markedly Y/Y, free cash flow generation (operating cash flow less capex) contracted yet remained positive near $28 million substantiating ongoing internal reinvestment capabilities [F1].
This pattern typifies franchise development phases where technology/digital transformation spending tempers short-term free cash conversion before expected longer-term efficiency gains materialize; managing this transition carefully is key for sustained shareholder value creation.
Risk Factors: Credit Environment, Regulatory Costs, Market Volatility
Risk disclosures underscore multiple facets impinging on operating stability: deteriorating credit quality particularly within commercial industrial loan segments alongside multifamily real estate exposures; sensitivity of net interest margins due to volatile interest rates; escalating regulatory compliance costs stemming from federal/state mandates; cybersecurity threats targeting IT infrastructure; liquidity variability driven by deposits concentration shifts; plus geopolitical uncertainties potentially influencing macroeconomic conditions across Peapack’s primary catchments [S1], [F1].
Management maintains regular stress testing frameworks evaluating liquidity adequacy under stressed conditions complemented by dynamic allowance for credit losses recalculated using updated CECL models incorporating recent portfolio experience patterns [S9], [S10].
Disclaimer: This analysis is intended solely for informational purposes reflecting data available as of early March 2026 without making explicit recommendations or predictive assertions about future stock performance or investment suitability.
Disclaimer: This is research-only, informational analysis and not investment advice. It may include AI-generated interpretation and general industry context. Always verify important details using primary sources.
Comments