
PRA Group’s Revenue Growth Masks Underlying Profit Challenges
Despite solid revenue expansion in 2025, PRA Group faced a sharp deterioration in operating and net earnings, reflecting operational and portfolio economics pressures.
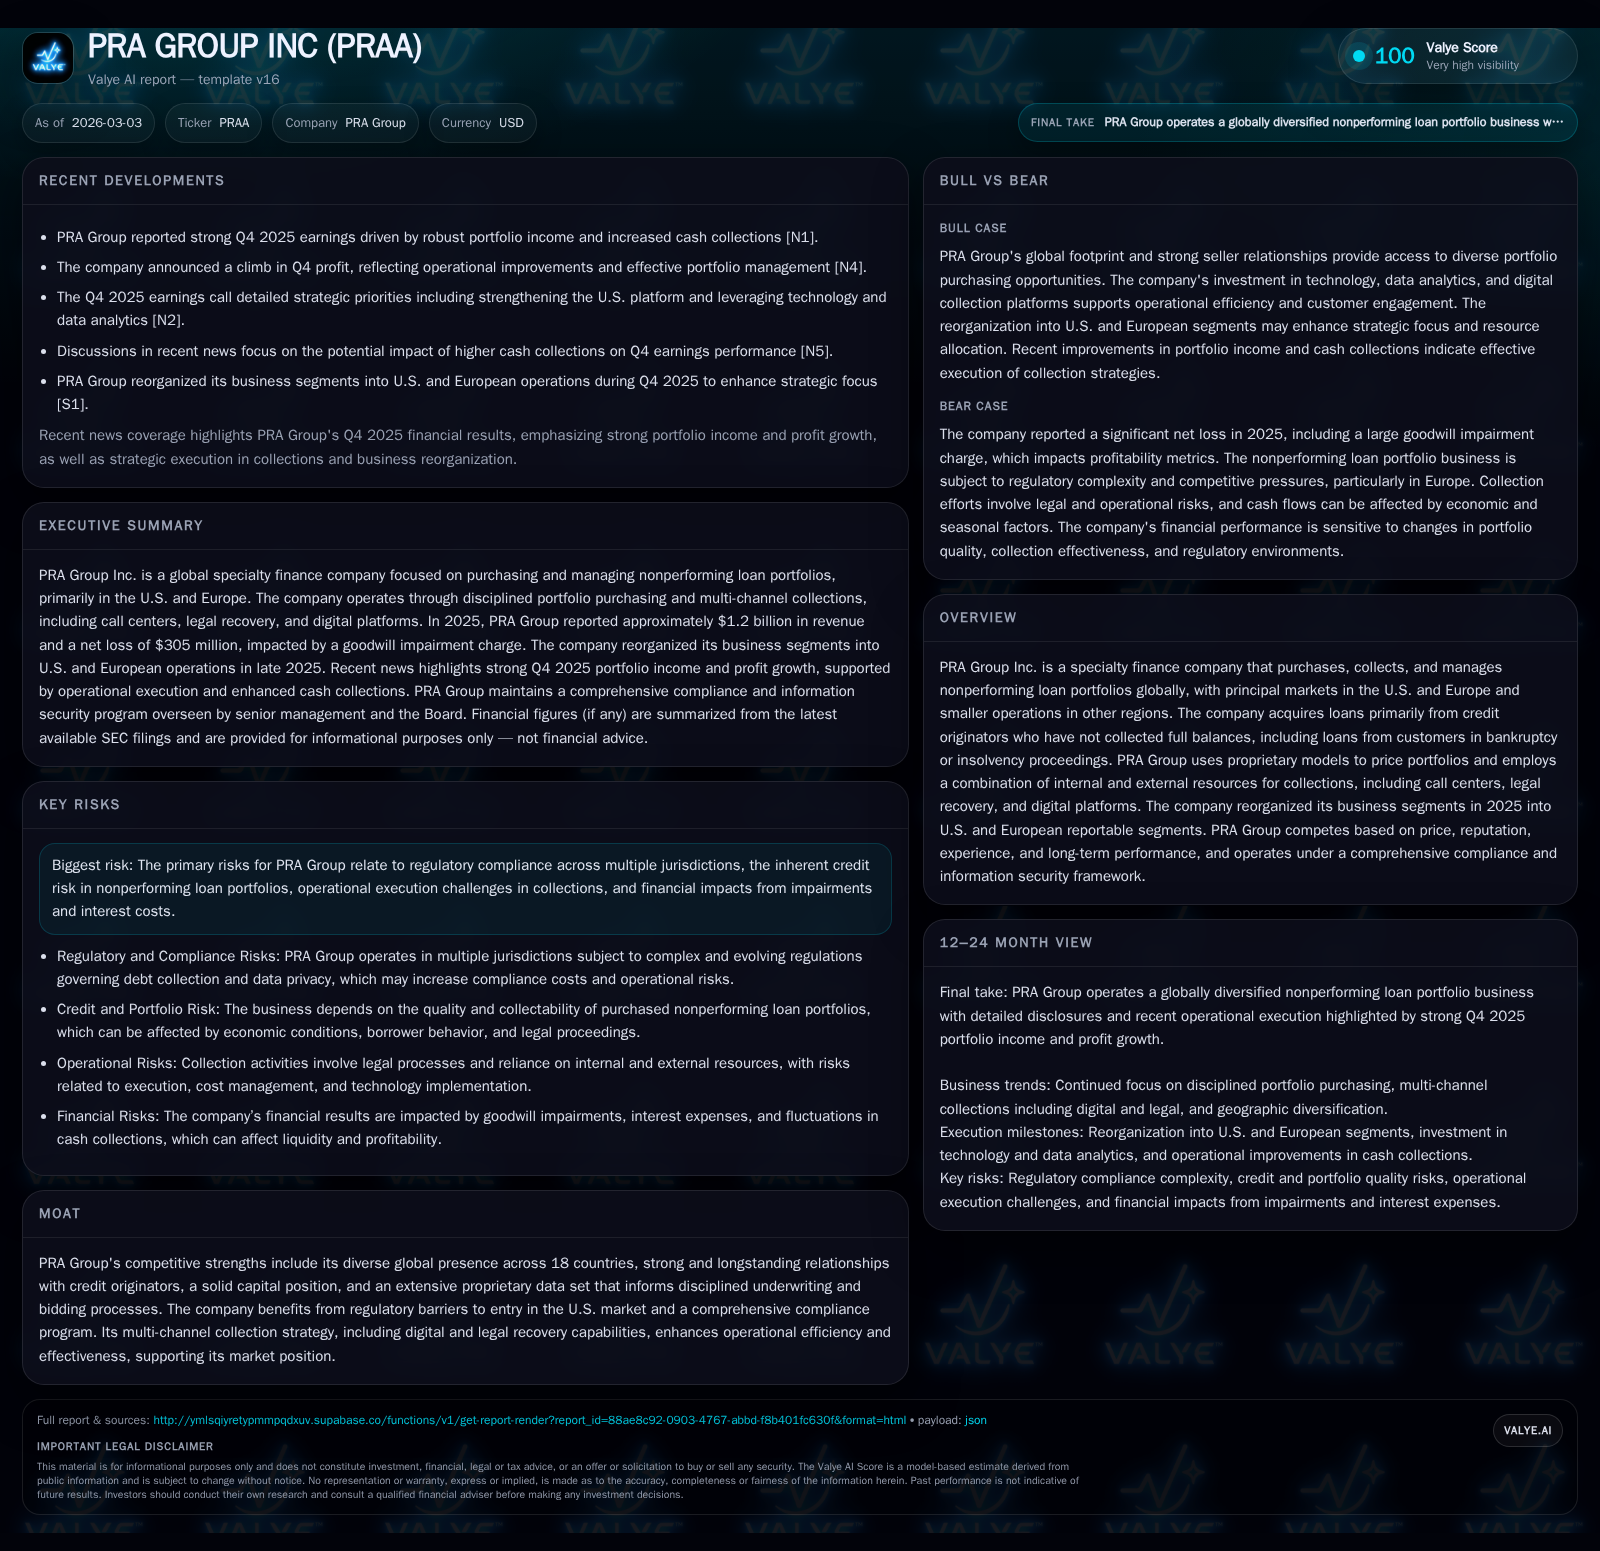
PRA Group Inc. reported a robust 7.8% increase in full-year 2025 revenue to $1.2 billion, driven by expanded nonperforming loan portfolio purchases primarily in the U.S. and Europe [F1]. However, profitability declined sharply with operating income falling to a $30 million loss and net income swinging to a $305 million loss, largely due to impairments and increased operational costs [F1][N1][N3]. The company restructured its business segments into U.S. and European units in late 2025 to sharpen geographic focus amid regional regulatory complexities [S6][S13]. The capital structure remains leveraged with over $3.6 billion of debt, including recent senior note issuances that support liquidity but increase interest expenses [S4][S16]. Cash flow remained negative, limiting capital returns despite modest share repurchases resuming after a two-year pause [F1]. PRA Group maintains comprehensive compliance and information security programs that serve as competitive moats but add to fixed costs [S1][S9]. The path to profitability recovery depends on improving portfolio acquisition economics, collection efficiency, cost control, and prudent capital management [N2][N3].
Strong Top-Line Expansion amid Changing Portfolio Economics
PRA Group Inc.'s fiscal year 2025 revenue increased approximately 7.8% year-over-year to about $1.20 billion, driven by expanded acquisition of nonperforming loan portfolios across its principal markets in the United States and Europe [F1][S1]. These portfolios include loans where obligors have defaulted or are involved in bankruptcy proceedings. Growth reflects higher portfolio purchase volumes enabled by enduring relationships with credit originators and proprietary valuation models leveraging extensive historical data sets.
The company increasingly relies on forward flow agreements—multi-period contracts for portfolio purchases—which provide volume visibility but introduce exposure to underlying portfolio quality deterioration clauses requiring active management [S24]. Seasonal factors such as employment cycles and tax refund timing continue to influence collection patterns.
Historical performance (annual)
| FY | Rev ($mm) | Net ($mm) | CFO ($mm) | OpInc ($mm) | Rev YoY | Net YoY |
|---|---|---|---|---|---|---|
| 2025 | 1202 | -305 | -86 | -30 | +7.8% | -532.2% |
| 2024 | 1115 | 71 | -95 | 340 | +38.9% | +184.6% |
| 2023 | 803 | -83 | -98 | 100 | -17.0% | -171.3% |
| 2022 | 967 | 117 | 22 | 286 |
Source: SEC companyfacts cache [F1].
Capital returns and efficiency (annual)
| FY | Buybacks ($mm) | FCF ($mm) | ROE% |
|---|---|---|---|
| 2025 | 20 | -90 | -31.1 |
| 2024 | 0 | -99 | 6.2 |
| 2023 | 0 | -100 | -7.2 |
| 2022 | 111 | 8 | 9.5 |
Source: SEC companyfacts cache [F1].
Operating cash flow remained negative except for FY2022; capital expenditures stayed modest.
Operational Shifts Driving Profit Volatility in 2025
Despite top-line growth, PRA Group incurred significant earnings pressure during FY2025 with operating income turning negative at around -$30 million compared to positive $340 million in FY2024—a stark margin contraction exceeding 100% year-over-year decline [F1]. Net income fell sharply into a $305 million loss largely due to a non-cash goodwill impairment charge of approximately $412.6 million taken in Q3 related to the Debt Buying and Collection reporting unit following sustained market capitalization declines impacting asset valuations [S18][N3].
This impairment underscores challenges such as elevated collection costs relative to recoveries, shifts toward higher-risk obligor profiles, and increased financing charges stemming from leveraged borrowings for portfolio acquisitions [S14][F1]. Cost containment initiatives launched late in the year began showing limited early impact.
The disconnect between revenue growth and profitability highlights complex portfolio economics where increasing volumes do not directly translate into proportional earnings gains given rising operational costs across multiple channels including legal recovery efforts and staffing adjustments balancing internal versus outsourced collections resources.
Segment-Wise Analysis: U.S. vs European Market Dynamics
Starting Q4 2025, PRA Group restructured its reporting framework into two main segments: U.S. operations and European operations [S6][S13]. This change facilitates targeted management of distinct regional regulatory environments, credit originator behavior, and collection practices.
The U.S. segment remains the largest platform with higher purchase activity but faces stringent state-level regulations governing collections that elevate compliance costs and limit aggressive recovery tactics [S9]. The European segment operates across multiple countries including the UK with moderate growth but greater regulatory heterogeneity involving bankruptcy laws and data privacy regulations such as GDPR that increase operating complexity while also serving as barriers against new entrants lacking compliance infrastructure.
Both segments rely heavily on forward flow agreements enabling predictable purchasing volumes but requiring vigilant quality monitoring to avoid contract renegotiations or terminations triggered by portfolio performance deterioration clauses [S24]. Investments in digital platforms—particularly within Europe—support scalable customer engagement methods enhancing efficiency while necessitating continuous technological upgrades.
Portfolio Acquisition and Collections Strategy Update
PRA Group’s competitive strength lies in its multi-channel collections strategy supported by proprietary data analytics built on over twenty years of transaction history enabling sophisticated underwriting and bid pricing for acquired portfolios [S1]. This dataset informs expected recovery projections adjusted for cost-to-collect parameters.
Collections utilize internally staffed call centers complemented by third-party agencies for certain geographies or account types alongside legal actions when economically justified [N4]. Digital self-service payment platforms reduce reliance on costly outbound calls adapting flexibly to changing consumer payment behaviors.
Forward flow agreements have become increasingly important providing volume stability from sellers but embed risk mitigation through termination rights protecting against adverse portfolio quality shifts—a critical feature given macroeconomic uncertainties affecting borrower repayment capacity.
Financial Leverage, Capital Structure, and Liquidity Positioning
As of September 30, 2025 disclosures show total borrowings exceeding $3.6 billion comprising revolving credit facilities across North America (including a combined domestic/Canadian limit of approximately $1.1 billion maturing October 2029), the UK (€730 million facility maturing November 2027), Europe alongside multiple tranches of senior notes due between 2028 and newly issued €300 million notes maturing September 2032 with fixed coupons near 6.25% payable semi-annually [S4][S16].
This leverage supports ongoing portfolio purchases sustaining liquidity but increases interest expenses which have weighed on margins contributing materially to FY2025 earnings pressure despite steady revenues.
Liquidity metrics remain stable with covenant compliance affirmed; however negative operating cash flows near -$85 million combined with modest capital expenditures (~$4.8 million) constrain free cash flow generation limiting potential for rapid deleveraging or dividend increases absent improved profitability or asset sales initiatives [F1].
Capital Allocation: Dividends, Buybacks, and Cash Flow Trends
Constrained by negative free cash flow estimated around -$90 million (operating cash flow minus capex), PRA Group resumed share repurchases totaling approximately $20 million during FY2025 after two years without buybacks while dividend payments remain minimal or paused reflecting prudent capital stewardship amid earnings uncertainty [F1].
Capital deployment prioritizes balance sheet strength supporting future investments over immediate shareholder returns given volatility driven largely by non-cash impairments overshadowing operational progress.
Ongoing negative operating cash flows from core collections emphasize need for disciplined capital spending focused primarily on technology infrastructure upgrades aimed at improving collection efficiencies rather than expansionary investments.
Regulatory and Compliance Framework Impacting Growth
PRA Group operates under comprehensive regulatory regimes across its global footprint encompassing federal, state, local U.S., European Union member states plus other jurisdictions mandating strict compliance with debt purchasing laws as well as data privacy regulations like GDPR particularly relevant within Europe [S9].
The company maintains an advanced information security program incorporating industry best practices including intrusion detection systems, email protections, endpoint security measures coupled with rigorous third-party vendor risk assessments overseen by Board-level Risk Committee ensuring enterprise-wide cybersecurity governance [S1].
While these frameworks create durable entry barriers protecting reputation and fostering trust critical for seller relationships—they also contribute significantly to fixed costs impacting margin profiles especially when combined with litigation risks from regulatory scrutiny or consumer claims occasionally resulting in loss provisions.
Outlook and Key Milestones to Monitor in 2026
Management commentary from early-2026 earnings calls emphasizes focus on improving collection yields through optimized resource mix leveraging AI-driven analytics for customer prioritization alongside disciplined capital allocation within defined return thresholds under stable leverage policies [N2][N3].
Key milestones include:
- Monitoring forward flow purchasing volumes signaling shifts in seller risk appetite;
- Tracking collection efficiency improvements via ERC growth adjusted for seasonal patterns;
- Assessing outcomes from cost reduction programs primarily within the U.S.;
- Evaluating interest expense trends influenced by refinancing or note redemption opportunities;
- Observing developments in regulatory investigations potentially affecting operations or imposing fines.
In summary, PRA Group retains competitive advantages anchored by scale, proprietary analytics, diversified geographic presence, and strong compliance infrastructure; however reported losses highlight significant challenges navigating profitability recovery amid volatile portfolio economics coupled with heightened regulatory complexity. Market participants should watch execution progress closely given historical earnings volatility despite encouraging revenue trends.
This analysis synthesizes publicly filed SEC financial statements along with recent news releases without providing investment advice regarding PRA Group Inc., ticker PRAA.
Disclaimer: This is research-only, informational analysis and not investment advice. It may include AI-generated interpretation and general industry context. Always verify important details using primary sources.

Comments