
PermRock Royalty Trust: Net Profits Interests Shape Returns Amid Commodity and Operator Risks
PermRock Royalty Trust delivers monthly cash distributions to unitholders by holding an 80% net profits interest in Permian Basin oil and gas properties managed by T2S. While its structure limits direct operational risk, the Trust’s cash flows remain highly sensitive to commodity prices and the capital decisions of its upstream operator.
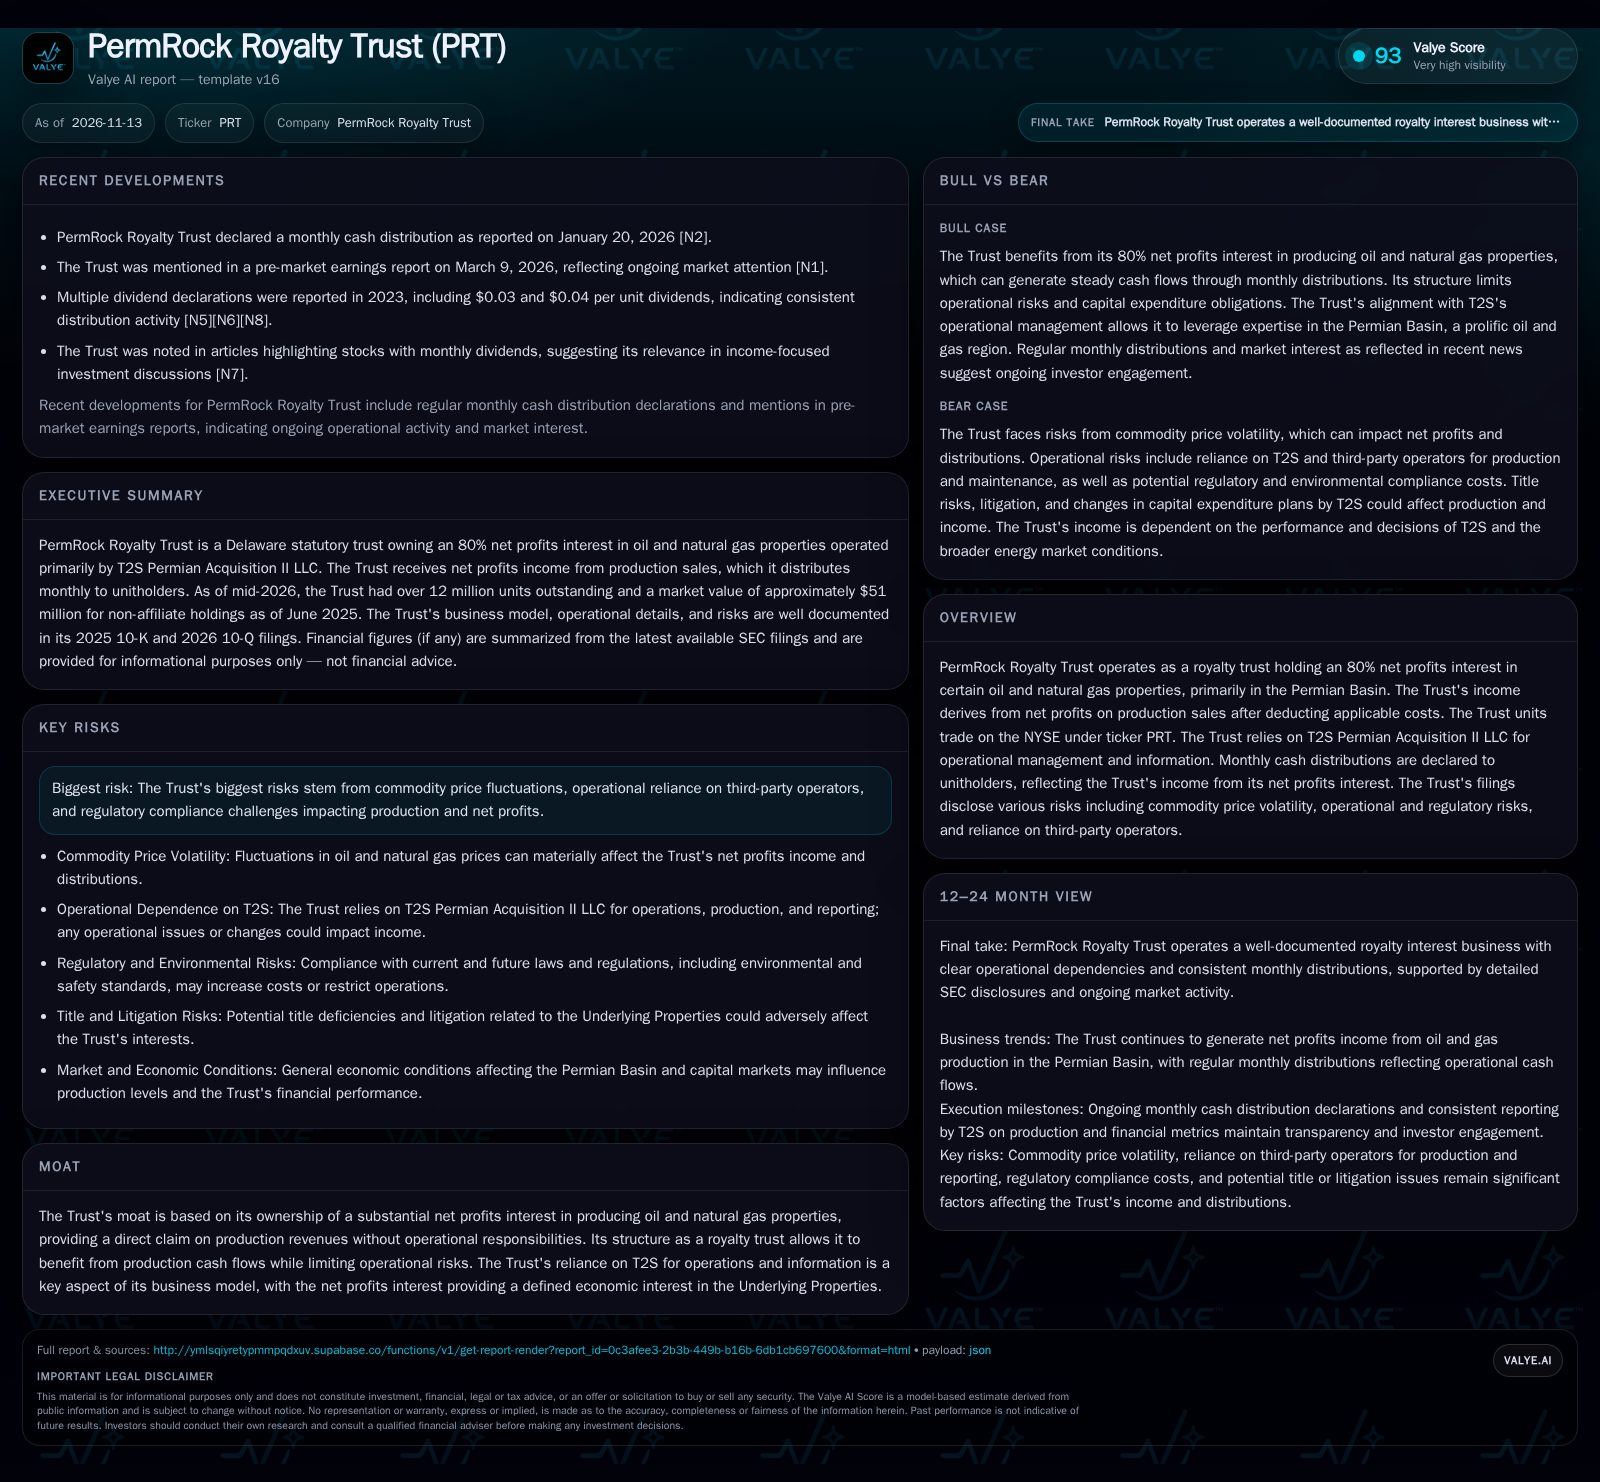
PermRock Royalty Trust (PRT) operates as a royalty trust with an 80% net profits interest in oil and gas assets, distributing monthly cash to unitholders. Its income is pass-through, reflecting production performance and subject to costs and commodity price swings. The Trust’s reliance on T2S for operations and reporting adds both leverage to operator execution and exposure to decisions outside the Trust’s control. Distributions have recently ranged from $0.03 to $0.04 per unit, but future payouts may fluctuate with market and operational dynamics. [N2] [N5] [N6] [N8]
PermRock Royalty Trust (PRT) exemplifies a pass-through vehicle in the U.S. energy sector, offering investors direct exposure to oil and gas production economics without the operational burdens of ownership. The Trust’s 80% net profits interest in Permian Basin properties, managed by T2S Permian Acquisition II LLC, underpins steady monthly cash distributions. However, the Trust’s fortunes are tied to the volatile interplay of commodity prices, operator execution, and regulatory risk. As a pure royalty trust, PRT’s ability to sustain attractive payouts hinges on production volumes, operator capital allocation, and the broader oil and gas price environment—factors largely outside the Trust’s direct control. [S1] [S2] [N2] [N5] [N6] [N8]
Recent Distributions Highlight Structural Dependencies
PermRock Royalty Trust continues to declare regular monthly cash distributions, with recent payouts in the $0.03–$0.04 per unit range as reported through early 2026. This consistency signals ongoing production and revenue flow from its 80% net profits interest in Permian Basin properties, which are operated by T2S Permian Acquisition II LLC. The Trust’s outstanding unit count stood at 12,165,732 as of March 2026, and non-affiliate market value was about $51 million as of June 2025. Importantly, all operational and financial information is provided by T2S, meaning the Trust’s reporting and payout cadence are tightly coupled to operator disclosures and performance. [S2] [N2] [N5] [N6] [N8]
Net Profits Interests as the Source of Distributable Cash Flow
PermRock Royalty Trust’s economics are fundamentally shaped by its 80% net profits interest structure. The Trust receives 80% of the net profits—defined as gross revenues from oil and gas production minus applicable costs (operating expenses, capital expenditures, and other deductions)—from the designated properties. This model passes through both the upside of commodity price spikes and the downside of cost inflation or production declines directly to unitholders, with minimal corporate overhead and no direct operating capital requirements for the Trust itself.
Distributions are made monthly, typically reflecting a lagged period of production and realized sales prices. Because the Trust does not control capital expenditures, drilling schedules, or hedging strategies, its cash flows can be volatile—amplifying the impact of commodity price swings and operational decisions by T2S. There is little to no operating leverage at the Trust level, but significant exposure to variable costs and production mix at the asset level. Major capital needs, such as new well development or property maintenance, are borne by the operator and deducted before net profits are calculated, potentially reducing distributable income during periods of high investment or operational disruption.
Energy Value Chain: Strengths and Risks of the Royalty Trust Model
PermRock Royalty Trust’s primary competitive advantage lies in its direct claim on a defined share of production cash flows, with no obligation for capital spending or operational management. This structure appeals to investors seeking income exposure to energy production without the risks of direct asset ownership or active management. However, the Trust’s position is inherently passive—it cannot influence cost structures, production optimization, or reinvestment strategies, which are all controlled by T2S.
Compared to other royalty trusts and similar pass-through vehicles, PRT’s economics and risk profile are typical: high sensitivity to underlying commodity prices, operator efficiency, and reservoir decline rates. The Trust’s focus on the Permian Basin, a prolific and competitive oil and gas region, provides potential for production stability but also exposes it to intense regional competition and the capital allocation decisions of large independent and integrated producers. Substitutes for PRT include other energy royalty trusts, master limited partnerships (MLPs), and direct mineral/royalty ownership, each with distinct liquidity, risk, and tax characteristics.
Factors That Could Boost Distributions and Unit Value
A favorable scenario for PermRock Royalty Trust would involve a sustained rally in oil and gas prices, combined with stable or rising production volumes from the Underlying Properties. If T2S successfully controls costs and invests in efficient new drilling, the net profits pool could expand, resulting in higher monthly distributions. Additional upside could come from operational improvements, reserve additions, or accretive property enhancements initiated by T2S.
Evidence that would confirm this scenario includes a pattern of rising distributions per unit, positive operator production and reserve updates, and news of new well completions or enhanced recovery projects. A narrowing gap between gross revenues and applicable costs (i.e., improved net margins) would also support this case. Conversely, any sustained increase in distributions accompanied by clear disclosures of production growth and cost discipline would be a strong confirming signal.
Income Stability Hinges on Market Conditions and Operator Performance
The most plausible near-term outcome is continued monthly distributions in the current $0.03–$0.04 per unit range, reflecting steady but unexceptional production and commodity price conditions. The Trust’s income will likely track operator-reported production and realized prices, with periodic fluctuations due to market volatility or operational factors (such as maintenance downtime or cost spikes).
If distributions remain consistent but do not show a trend of sustained growth, it would suggest that the Trust is capturing the status quo of its asset base and is not benefitting from incremental operator-driven upside or material commodity price moves.
Potential Impact of Commodity Price Declines and Operator Challenges on Payouts
A bearish scenario for PermRock Royalty Trust would be triggered by a sharp decline in oil and/or gas prices, a significant production shortfall, or a spike in operating/capital costs absorbed by T2S. Because all costs are deducted before net profits are calculated, any combination of lower realized prices and higher costs can quickly compress or eliminate distributable income. Regulatory changes, litigation, or adverse events affecting title to the Underlying Properties could further exacerbate downside risk.
Evidence confirming this scenario would include a marked reduction or suspension of monthly distributions, negative production or reserve updates from T2S, and disclosures of major operational setbacks or cost overruns. If monthly payouts fall below recent levels or become erratic, especially without corresponding commodity price recovery, it would indicate the Trust is experiencing operational or market-driven distress.
Key Developments That Could Influence PermRock Royalty Trust Outcomes
Monthly distribution per unit trends: Persistent increases, decreases, or volatility in declared cash distributions would provide a real-time signal of asset performance and market exposure.
Reported production volumes and reserve updates from T2S: If disclosed, these metrics would reveal whether the asset base is maintaining, growing, or declining—key to future income sustainability.
Cost structure and capital expenditure levels at the Underlying Properties: A useful metric would be the ratio of gross revenues to applicable costs, as rising costs or major capex can depress net profits.
Commodity price movements for oil and natural gas: External price benchmarks directly impact the Trust’s distributable income with little buffer.
Operator (T2S) disclosures on drilling activity and maintenance: Announcements of new wells, enhanced recovery, or maintenance downtime would help forecast production and cash flow direction.
Regulatory or litigation developments affecting the Underlying Properties: Any disclosed changes in environmental, title, or regulatory status could materially alter the Trust’s income and risk profile.
Unit count changes or major secondary offerings: While not typical, any material change in the Trust’s outstanding units or capital structure would impact per-unit economics.
Disclaimer: This is research-only, informational analysis and not investment advice. It may include AI-generated interpretation and general industry context. Always verify important details using primary sources.

Comments