
Quaint Oak Bancorp’s Earnings Contraction Contrasts with Strong Regional Deposit Base
The Pennsylvania-focused bank holding company faces pressure from commercial real estate concentration and funding cost sensitivity despite regulatory compliance.
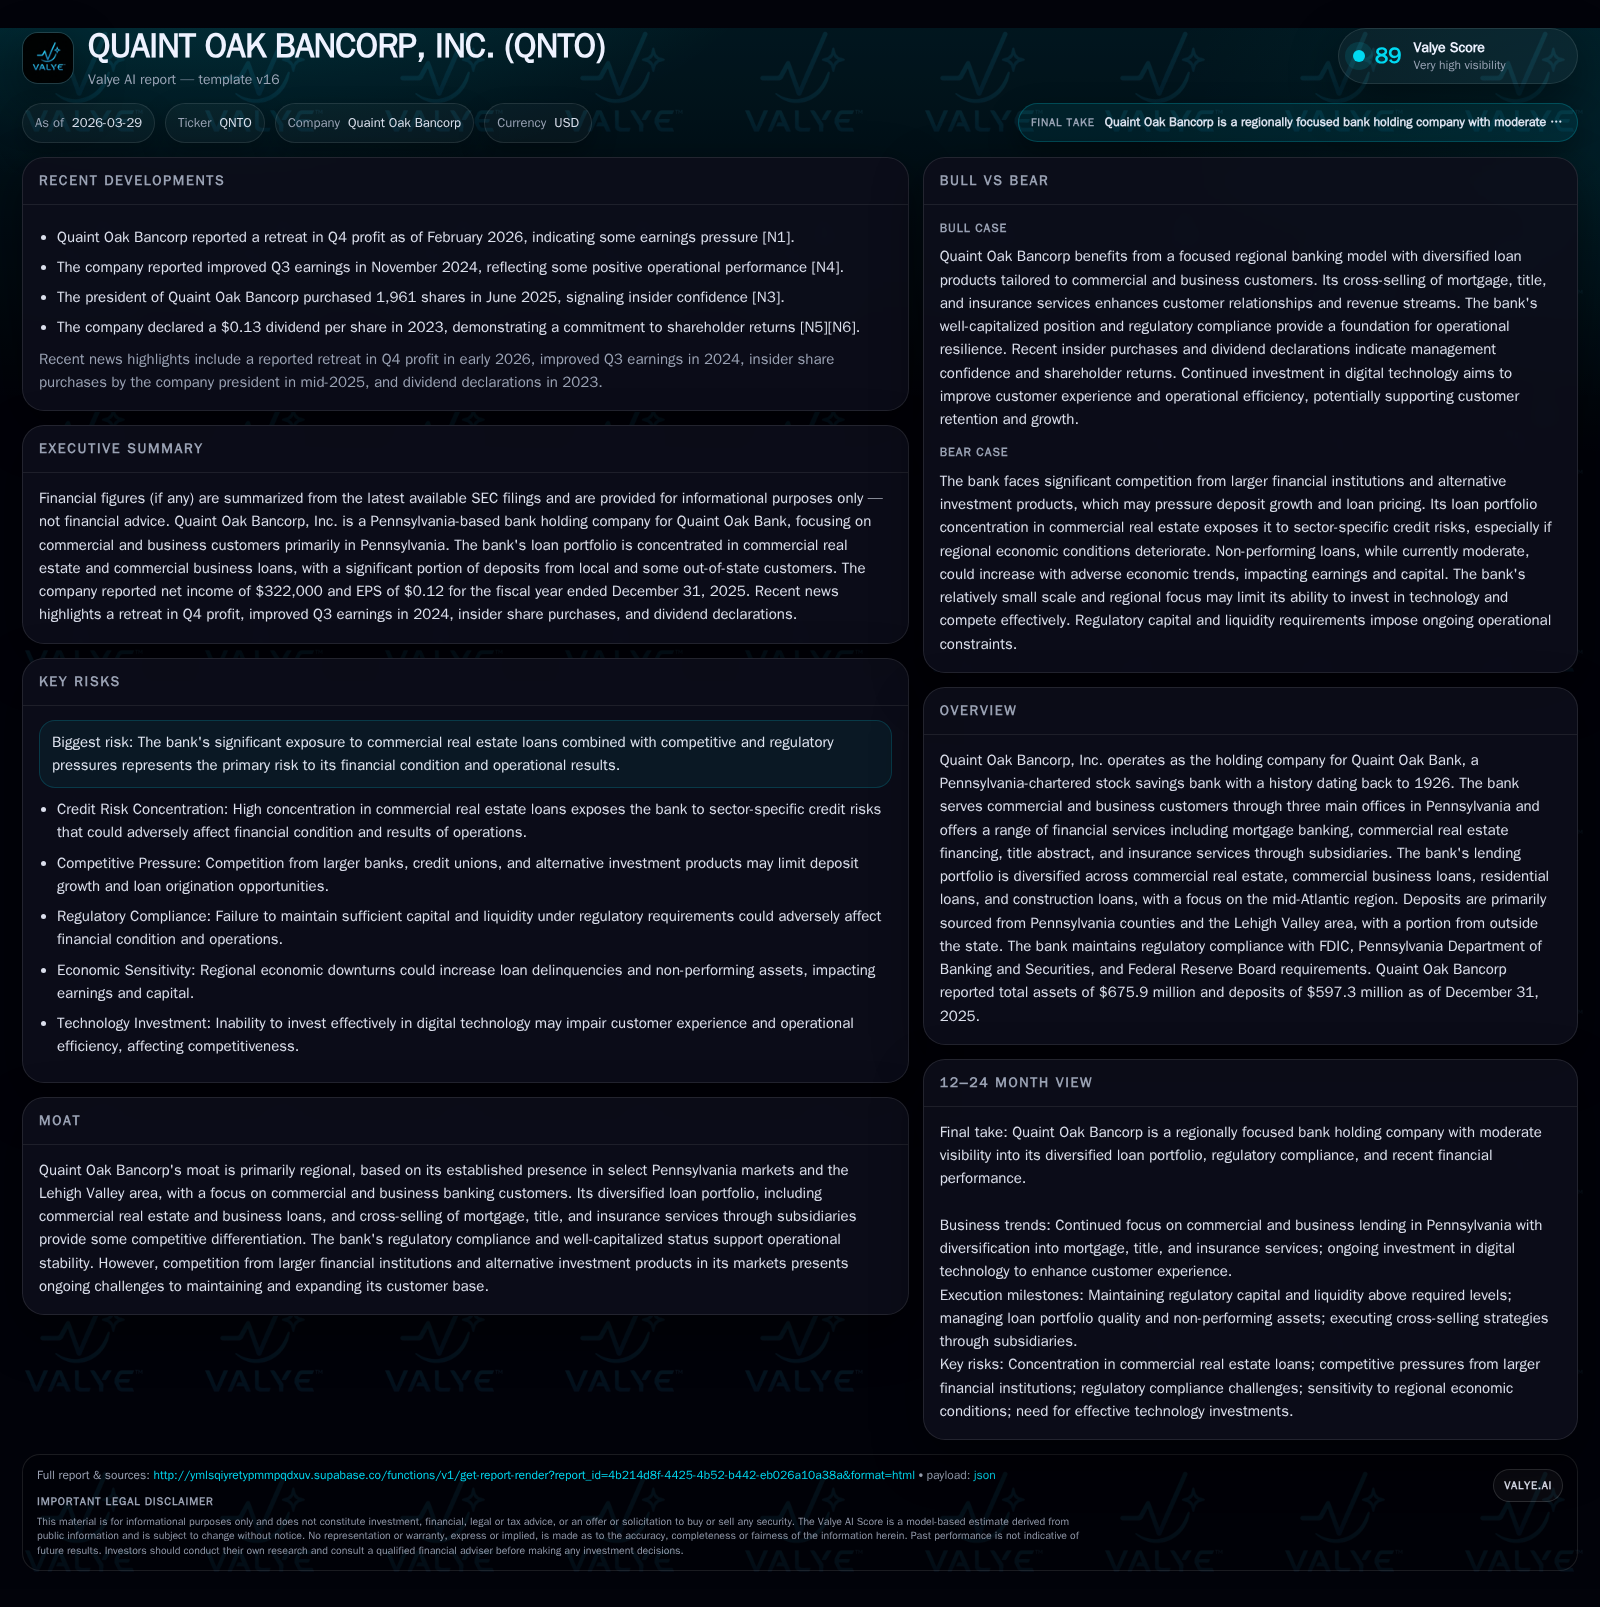
Quaint Oak Bancorp, Inc. serves commercial and business banking clients primarily in select Pennsylvania markets with a diversified loan portfolio heavily weighted toward commercial real estate. The company’s earnings sharply declined in 2025 due to margin compression and higher costs, despite stable deposit growth and strong capital ratios. Liquidity risks persist from concentrated certificates of deposit requiring competitive interest rates to retain, while its regulatory compliance remains robust. Future growth depends on disciplined credit management amid elevated commercial real estate exposure and prospective shifts in funding costs.
Company Overview
Quaint Oak Bancorp, Inc., founded as a holding company in 2007, operates Quaint Oak Bank, which traces its origins back to 1926. Headquartered in Southampton, Pennsylvania, the bank concentrates its commercial and business banking activities primarily in Bucks, Montgomery, Philadelphia counties, and the Lehigh Valley region. It operates three offices within this footprint plus ancillary mortgage and insurance subsidiaries offering products such as mortgage loans underwritten against GSE guidelines, specialty commercial real estate financing through Oakmont Commercial, title abstract services, and insurance coverage.
This regional business model is anchored in serving mid-sized businesses and property owners through a diversified loan portfolio heavily weighted towards commercial real estate but also incorporating residential owner-occupied and construction loans. Deposits stem largely from local certificate of deposit (CD) programs alongside money market and business checking accounts.
Historical Financial Performance
Over the past four years ending December 31, 2025, Quaint Oak Bancorp's financial performance shows significant volatility marked by a sharp decline in profitability during the latest fiscal year:
Historical performance (annual)
| FY | Net ($mm) | CFO ($mm) | OpInc ($mm) | Net YoY |
|---|---|---|---|---|
| 2025 | 0 | 4 | 1 | -88.5% |
| 2024 | 3 | 33 | 3 | +38.4% |
| 2023 | 2 | 73 | 3 | -74.3% |
| 2022 | 8 | -12 | 13 |
Source: SEC companyfacts cache [F1].
Capital returns and efficiency (annual)
| FY | Div ($) | Buybacks ($) | ROE% |
|---|---|---|---|
| 2025 | 894000 | 44000 | 0.6 |
| 2024 | 1338000 | 150000 | 5.3 |
| 2023 | 1154000 | 433000 | 4.2 |
| 2022 | 1018000 | 49000 | 17.6 |
Source: SEC companyfacts cache [F1].
The above indicates an operating income drop of over 81% year-over-year into FY2025 along with a net income decrease nearing 89%. Operating cash flow remains positive albeit also declining approximately 87% compared to prior year levels [F1]. Capital expenditures continue to be minimal relative to overall operations.
Dividends have been consistently paid throughout this period though reduced slightly in the latest year alongside sharply curtailed share repurchases.
Loan Portfolio Composition and Credit Risk Profile
Quaint Oak Bank's loan portfolio as of December 31, 2025 totaled approximately $547 million (excluding loans held for sale), predominantly composed of:
- Commercial Real Estate: $310 million (56.7%)
- Commercial Business Loans: $96.3 million (17.6%)
- One-to-Four Family Residential Owner Occupied: significant share though exact figure truncated [S1][S5][S12][S28]
- Construction Loans: $23.5 million (4.3%)
- Multi-Family Residential Loans: ~$40.8 million (7.5%)
- Home Equity Loans: $5.4 million (1%) – product sunset since late September 2024.
The loan approval process involves credit and collateral assessment through a dedicated loan committee ensuring compliance with internal underwriting standards emphasizing debt service coverage ratio thresholds (~1.20x).
However, the concentration in commercial real estate raises risks amid possible economic downturns impacting property values or tenant occupancy affecting borrowers’ serviceability [S10][S21][S22]. The bank reports nonperforming assets totaling approximately $7.7 million at end-2025 including accrued delinquent loans [S23].
Deposit Base and Funding Structure
Deposits at year-end stood at about $597 million comprised primarily of certificates of deposit (61.3%), money market accounts (11.8%), interest-bearing checking (17.7%), non-interest bearing checking (~11%), and savings [S4][S13][S27]. Approximately $35 million corresponds to one major interest-bearing checking customer representing ca.6% of total deposits.
Notably:
- Nearly $245 million of CDs mature within one year creating refinancing risk.
- Brokered deposits sourced through national listing services constitute
$62 million of CDs (17.6%), indicating potential rate sensitivity. - The uninsured deposit portion (> $250k) is substantial at roughly $244 million (41%).
The bank supplements funding with borrowing lines from the Federal Home Loan Bank ($269 million capacity) and Federal Reserve discount window ($24 million capacity), although no outstanding borrowings were reported at year-end [S7][S14].
Capitalization and Regulatory Compliance
Quaint Oak maintains solid capitalization with a stockholders’ equity base around $52 million equating to approximately 7.7% of total assets as of December 31, 2025 [F1][S5]. Key capital ratios include:
- Common Equity Tier 1 ratio: ~12.36%
- Tier 1 risk-based capital ratio: ~12.36%
- Total risk-based capital ratio: ~13.55%
- Tier 1 leverage ratio: ~10.26%
These figures comfortably exceed applicable federal regulatory minimums required for a "well-capitalized" status [S11][S15][S20]. Additionally, Quaint Oak has not utilized the Community Bank Leverage Ratio framework but monitors related regulatory developments closely.
Heightened regulatory scrutiny post recent regional banking stresses has increased compliance demands though Quaint Oak currently faces no material litigation outside routine legal matters [S24].
Revenue Streams beyond Lending
Beyond traditional lending spreads, Quaint Oak Bancorp operates through subsidiaries providing complementary revenue sources such as mortgage banking—with volume sales into secondary markets generating routine gains—title abstract services offering title insurance policies locally, and insurance brokerage covering home, auto, life and business risks [S18]. Cross-selling these products tightens customer relationships within their regional niche.
Risks and Challenges
Primary risks outlined by management include:
- Commercial Real Estate Concentration: Over half the loan book comprises CRE loans that are susceptible to cyclical downturns or deteriorating local market conditions.
- Deposit Concentration & Liquidity Risk: A sizeable portion of funding comes from CDs sensitive to competitive interest rates; failure to renew these could raise funding costs materially.
- Regulatory & Compliance Pressure: Increased oversight may constrain operational flexibility or impose additional costs.
- Limited Scale & Competitive Pressure: Larger regional banks or alternative financial products might erode market share.
These factors necessitate prudent credit underwriting standards and active liquidity management [S1][S16][S24].
Outlook & Key Milestones to Monitor (Analysis)
No explicit forward guidance was disclosed for upcoming periods [N#].[S2]. Stakeholders should watch metrics including:
- Loan growth trends across commercial real estate vs other segments as an indicator of credit appetite shifts.
- Deposit retention rates especially among brokered CD holders.
- Interest margin evolution reflecting competitive pressure on rates paid amidst general macroeconomic shifts.
- Asset quality signals such as delinquencies or charge-offs within the concentrated portfolios.
- Regulatory capital trends amid evolving prudential requirements.
The company’s strategy will likely emphasize maintaining underwriting discipline while leveraging cross-sold service offerings to reinforce customer loyalty within its geographic footprint.
Returns & Capital Allocation Patterns
Return on equity for fiscal year ended December 31 2025 was approximately only 0.6%, following much stronger returns in prior years impacted by earnings erosion [F1]. Operating cash flow remained positive at about $4.15 million yielding positive free cash flow after nominal capital expenditures (~$0.25–0.45 million range historically).
Consistent dividend payments reflect an intent to maintain shareholder distributions albeit reduced proportionally with falling earnings [F1]. Share repurchases continue on a limited basis suggesting modest capital return policies restrained by earnings volatility.
DISCLAIMER: This analysis is prepared solely for informational purposes based on available filings up to March 29, 2026 and does not constitute investment advice or recommendations.
Disclaimer: This is research-only, informational analysis and not investment advice. It may include AI-generated interpretation and general industry context. Always verify important details using primary sources.
Comments