
FreightCar America’s Revenue Retraction and Market Position in 2025
A century-old railcar manufacturer faces revenue declines amid heightened customer concentration and persistent backlog contraction.
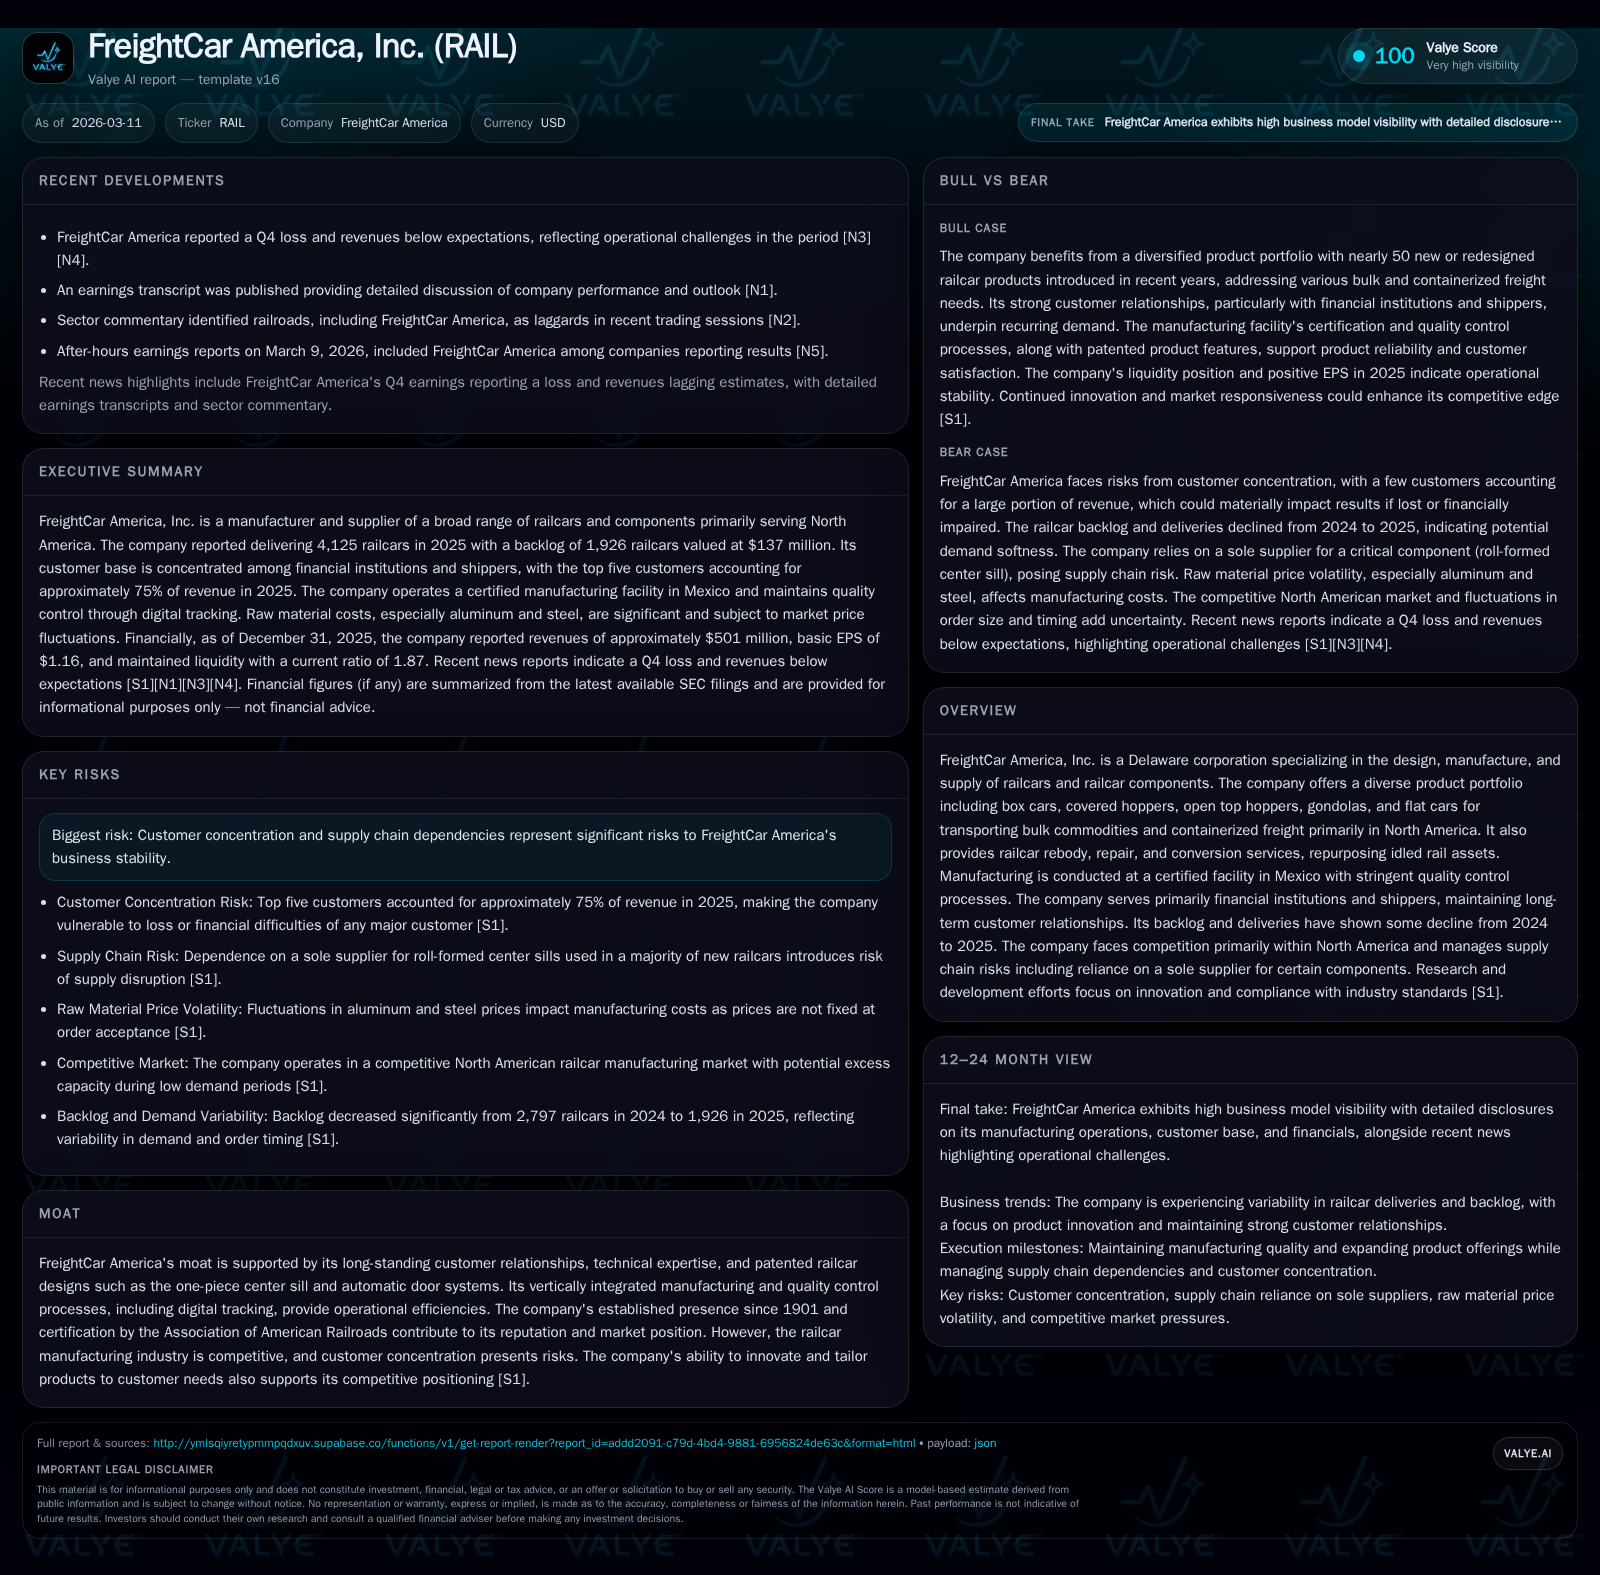
FreightCar America, Inc., a longstanding player in North American railcar manufacturing since 1901, experienced a notable 10.4% drop in revenue for fiscal year 2025, with deliveries and backlog also retreating. The company is increasingly reliant on a concentrated customer base—primarily financial institutions—that accounted for about 75% of revenue in 2025, up from roughly 48% in the prior year. Despite challenges, FreightCar America leverages patented product innovations and vertical integration to sustain operational efficiency and maintain customer relationships. Operating income declined by 9.2%, with free cash flow remaining positive. Management suspended dividends post-2024 to preserve liquidity amid uncertain demand dynamics.
Historical Revenue Performance and Backlog Dynamics
FreightCar America’s revenues declined by approximately 10.4% to $500.99 million in fiscal year 2025 compared to $559.43 million in the prior year, reflecting softer demand across its railcar portfolio [F1]. Deliveries fell modestly from 4,362 units delivered in FY2024 to 4,125 units in FY2025; new railcar production decreased from about 4,252 to 3,714 units while rebuilt car deliveries increased from 110 to 411 units indicating a shift toward repair/rebody activities [S1].
The firm’s order backlog—a key indicator of future revenue visibility—contracted significantly ending at approximately 1,926 railcars as of December 31, 2025, down from nearly 2,797 at the prior year-end [S9]. The estimated sales value of the backlog dropped from $266.52 million to $137.47 million. While backlog typically converts within two years, this decline signals weakening OEM demand amid broader freight transport trends.
Historical performance (annual)
| FY | Rev ($mm) | CFO ($mm) | OpInc ($mm) | Capex ($mm) | Rev YoY |
|---|---|---|---|---|---|
| 2025 | 501 | 35 | 34 | 3 | -10.4% |
| 2024 | 559 | 45 | 37 | 5 | +56.2% |
| 2023 | 358 | 5 | 10 | 13 | -1.8% |
| 2022 | 365 | 12 | -15 | 8 |
Source: SEC companyfacts cache [F1].
Capital returns and efficiency (annual)
| FY | Div ($mm) | FCF ($mm) |
|---|---|---|
| 2025 | 0 | 31 |
| 2024 | 28 | 40 |
| 2023 | -8 | |
| 2022 | 4 |
Source: SEC companyfacts cache [F1].
*FY2025 figures sourced from latest filings; net income figures not fully available past FY2021 due to losses previously reported.[F1]
Customer Concentration and Supply Chain Risks
FreightCar America’s revenue is heavily concentrated among institutional financial buyers and shippers primarily serving North America: these groups represented approximately 78% and 16%, respectively, of total sales for calendar year ending December 31, 2025 [S1]. Concentration intensified with the top five customers accounting for roughly three-quarters (75%) of total revenue in 2025 versus about half (48%) the prior year — heightening earnings volatility risk should key customers alter purchasing patterns abruptly [S4], [S5].
Supply chain dependencies compound operational risks; raw material costs dominate manufacturing expenses with steel and aluminum prices variable under customer pricing formulas but critical bottlenecks exist notably for roll-formed center sills sourced from a sole supplier supplying about two-thirds (66%) of new railcars manufactured during calendar year 2025 versus just over half (51%) the prior year — exposing significant disruption risks if supplier capacity or quality issues emerge or geopolitical conditions worsen [S11]. Top ten suppliers accounted for nearly seven out of every ten dollars spent on purchases (68%), tightening procurement risk.
Product Innovation as Competitive Differentiator
FreightCar America sustains competitive positioning through product innovation anchored by proprietary engineering developments and vertical integration that reinforce its moat within North America's competitive OEM market space [S1]. Over seven years it introduced approximately fifty new or redesigned freight car types including box cars (50’ &60’), covered hoppers with cubic capacities up to over six thousand cubic feet, open-top hoppers featuring patented automatic door systems improving operational efficiency for ballast/ore/coke transport, gondola variants including rotary aggregate designs, intermodal flats including multi-unit well cars, and flat cars tailored for steel slab transport or bulkhead applications.
Patented features such as the one-piece center sill bolster structural integrity essential for load-bearing performance while integrated quality assurance provides enhanced production scheduling and defect minimization relative to competitors relying more on subcontracted assemblies [S1], [S5]. This approach supports performance guarantees demanded by institutional clients aligned with Association of American Railroads standards.
Segment Overview: Manufacturing vs Aftermarket
Operations are divided into two segments: Manufacturing—including new build railcars plus used sales and major conversions/rebodies—and Aftermarket comprising forged/cast/fabricated parts sales alongside services such as safety training, inspections, and preventative maintenance across all fleets regardless of origin manufacturer [S6], [S7].
Manufacturing dominates revenue generation with quarterly revenues exceeding $150 million while Aftermarket contributions are smaller ($6–7 million quarterly) but characterized by higher margin persistence driven by recurring part replacements and service contracts rather than lumpy OEM sales variability.
This segmentation partially insulates earnings against downturns affecting new build demand but requires broad technical expertise across legacy models including those manufactured externally.
Financial Overview: Profitability and Cash Flow
Despite lower revenues FreightCar America maintained positive operating income at about $33.92 million for FY25 representing a decline of roughly 9.2% compared with FY24 ($37.34 million) indicating preserved operational leverage amid shrinking volumes [F1]. Net income remains historically negative with last reported loss exceeding $41 million in FY21; ongoing costs include interest expense on ~$108 million long-term debt alongside warrant liability volatility affecting comprehensive profitability assessments.
Free cash flow remains positive at approximately $31.4 million derived from operating cash flow ($34.78 million) less capital expenditures ($3.38 million), though operating cash flow declined by about 22.6% YoY while capex was reduced significantly (-32.7%), reflecting prudent investment pacing aligned with current capacity utilization expectations [F1].
Capital Allocation: Dividend Suspension and Investment Caution
Management suspended dividend payments following a payout totaling $27.86 million in FY24 reflecting a strategic shift prioritizing liquidity preservation amid uncertain demand and backlog contraction [F1], [N1]. Reduced capital expenditures support balance sheet flexibility postponing large-scale reinvestment until market conditions clarify.
This approach balances sustaining operational readiness through maintenance capex against minimizing discretionary spending given the cyclical nature inherent to heavy industrial OEMs facing freight industry headwinds.
Outlook and Risk Factors
Management commentary indicates cautious expectations for backlog recovery due partly to supply chain disruptions including component lead times combined with conservative purchasing behavior among financial lessors wary of fleet saturation risks amid macroeconomic freight volume uncertainties [N1], [S9].
Monitoring booking velocity—the pace of new firm orders—and reconditioning activity scale will provide early indicators of OEM cycle shifts or aftermarket strengthening tied to fleet utilization.
Mitigating sole-supplier dependency risks particularly around patented center sill production remains critical given its impact on build schedules disrupting delivery commitments [S11].
Strategic Implications of Customer Reliance on Institutional Buyers
Heavy reliance on financial institution clients confers stability via multi-year leasing contracts embedding cancellation fees but also exposes FreightCar America to cyclicality linked to asset utilization sensitive to transportation sector economics [S8], [S5]. Contractual provisions allowing delayed deliveries or inspection rights add backlog execution uncertainty complicating revenue recognition reliability.
Long-term strategies may focus on expanding aftermarket parts/services offerings designed to smooth earnings volatility alongside selective diversification into commercial shipping customers beyond dominant lessors.
Summary
Entering its second century milestone FreightCar America confronted pronounced top-line retrenchment driven chiefly by weakened OEM order flow alongside intensifying customer concentration that increased revenue volatility risks during calendar year 2025.[F1],[S1] Deployment of patented design technology combined with vertical integration supports operational efficiency serving as important differentiators amid North American competition.[S1],[S11] Financially management prioritized liquidity retention evidenced by dividend suspension paired with calibrated capex spend reflecting prudence under market uncertainty.[F1],[N1] Future progress hinges on broadening customer base beyond institutional buyers while monitoring backlog health amidst supply chain pressures—a delicate balance common within capital-intensive industrial manufacturing sectors.
This analysis is based solely on publicly disclosed information available as of March 11, 2026 without offering specific investment advice.
Disclaimer: This is research-only, informational analysis and not investment advice. It may include AI-generated interpretation and general industry context. Always verify important details using primary sources.
Comments