
Ready Capital Corp’s Strategic Shift in Lower Middle Market Lending and SBA Loan Growth
Ready Capital evolves its portfolio mix while managing liquidity pressures from debt maturities through securitization and SBA lending specialization.
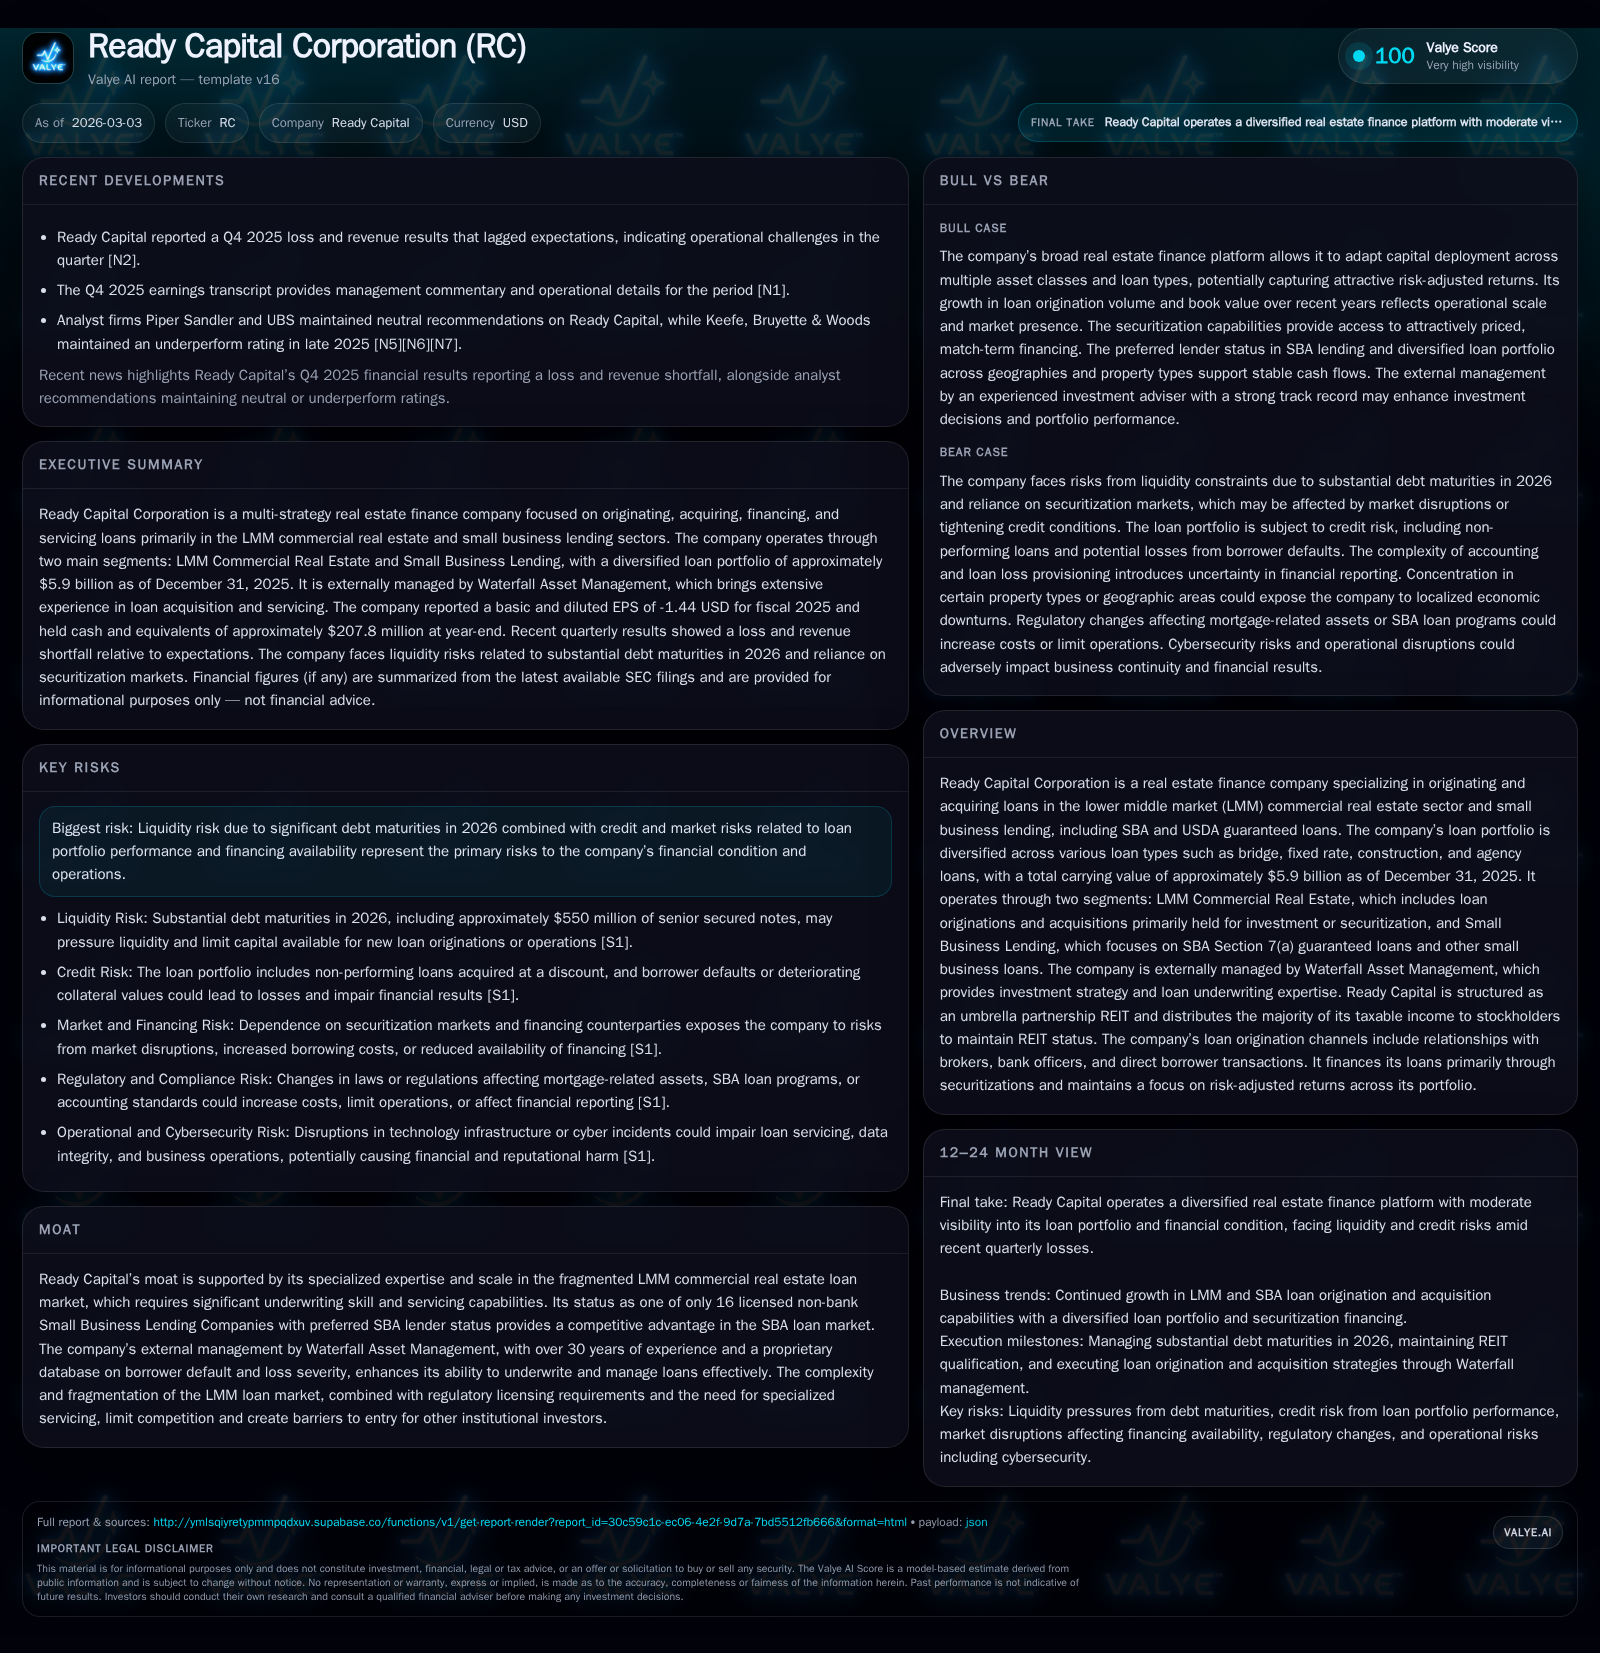
Ready Capital Corporation demonstrated significant growth in operating cash flows and maintained a diversified loan portfolio across lower middle market (LMM) commercial real estate and Small Business Administration (SBA) loans in 2025. The company’s strategic focus on SBA Section 7(a) loans, secured by preferred lender status, underpins future growth prospects despite liquidity challenges posed by sizable debt maturities in 2026. Securitization of LMM loans and SBA loan sales remain critical financing tools, while equity contraction and dividend payments reflect capital allocation balancing amid uncertain refinancing conditions. Investors should monitor securitization capacity, asset disposition outcomes, and refinancing progress as key milestones ahead.
Examining 2025 Financial Performance and Portfolio Composition
Ready Capital Corp has exhibited meaningful financial momentum led by operational cash flow gains despite shifting equity levels tied partly to capital return policies. According to the latest SEC filings covering fiscal year ending December 31, 2025, net income was last reported for FY2020 at approximately $27 million—a notable increase compared to prior years (e.g., $20 million in FY2019) though more recent specific net income figures beyond FY2020 are not disclosed [F1]. Operating cash flow surged dramatically by over 57% year-over-year to $432 million in FY2025 from prior periods ($275 million in FY2024), highlighting strong cash generation from core underwriting and portfolio servicing activities [F1]. Equity contracted to $1.54 billion at the end of FY2025 from over $2.5 billion two years prior, reflecting dividends paid exceeding $113 million coupled with share repurchases approaching $68 million for the same period—pointing to an active capital allocation posture balancing shareholder returns amidst operational reinvestment needs [F1].
Historical performance (annual)
| FY | CFO ($mm) |
|---|---|
| 2025 | 432 |
| 2024 | 275 |
| 2023 | 51 |
| 2022 | 359 |
Source: SEC companyfacts cache [F1].
Capital returns and efficiency (annual)
| FY | Div ($mm) | Buybacks ($mm) |
|---|---|---|
| 2025 | 113 | 68 |
| 2024 | 206 | 82 |
| 2023 | 215 | 18 |
| 2022 | 188 | 37 |
Source: SEC companyfacts cache [F1].
Note: Net income data available only through FY2020 per company facts.
Loan Segments Explored: LMM Commercial Real Estate and Small Business Lending
Ready Capital operates principally through two segments that embody distinct risk-return profiles: Lower Middle Market (LMM) Commercial Real Estate loans and Small Business Lending focused on SBA Section 7(a) guaranteed loans.
The LMM commercial real estate segment accounted for roughly four-fifths of the carrying value of the $5.9 billion loan portfolio at year-end December 31, 2025 [S8,S9]. This segment includes a full suite of loan categories: bridge loans comprise over half the balance ($3.44 billion), fixed-rate loans about $706 million with longer amortizations typical for stabilized properties; construction loans represent a smaller portion ($388 million), mainly short-duration financing for developments; and agency loans under Freddie Mac’s Small Balance Loan program occupy a niche but important role ($20.5 million), with such loans sold subsequently to the agency market post-origination [S9,S13]. The average loan sizes range up to $40 million with amortization often spanning two to six years depending on loan type.
Non-performing loans within this segment involve higher leverage properties or distressed borrowers acquired at discounts aimed at borrower-based resolution strategies—highlighting the specialized credit workout expertise Ready Capital applies [S12]. The weighted average loan-to-value stands at around 76% for originated loans but climbs significantly to nearly 97% on acquired portfolios reflecting their higher risk profiles [S12].
By contrast, the Small Business Lending (SBL) segment focuses on SBA Section 7(a) guaranteed owner-occupied loans with a carrying portfolio value near $1.1 billion (~18.6% of total), supported by Ready Capital’s rare standing as one of only sixteen non-bank Small Business Lending Companies holding preferred lender status with the SBA—a regulatory moat critical for origination efficiency and secondary market access [S16,S1]. These loans benefit from partial government guarantees reducing credit risk substantially relative to LMM commercial assets.
Ready Capital sells qualifying SBA guaranteed loans into secondary markets generating premium income which is reinvested or used for capital recycling. Securitization structures support funding of retained portions enabling matched long-term financing backed by investment-grade tranches issued since late-2019 through mid-2023 issuances [S25,S6].
Liquidity Profile and Implications of Maturing Debt in 2026
The company faces significant liquidity challenges due to substantial debt maturities scheduled across calendar year 2026 amounting to approximately $550 million in senior secured notes plus additional corporate debt obligations [S4,S18]. Nonetheless, sufficient liquidity cushions exist including roughly $200 million of unrestricted cash alongside approximately $700 million of unencumbered assets potentially available for sale or collateralization to support refinancing efforts.
Despite these buffers, management acknowledges uncertainty around realizing full net liquidity from asset dispositions or portfolio repayments given market volatility conditions affecting valuations [S4]. Leverage ratios remain moderate at a total leverage ratio of about 3.5x on net assets with recourse leverage split differently across segments (0.5x for LMM CRE and about 0.2x for SBL), implying conservative borrowing tailored differently by underlying asset risk [S5]. This nuanced leverage profile mitigates but does not eliminate refinancing or margin call risks especially when asset price declines trigger collateral top-ups under repurchase agreements common in their warehouse financing stack [S8,S14].
Failure or delay in refinancing upcoming maturities could compel asset sales at suboptimal prices eroding book value and potentially curtail new loan originations or acquisitions needed for growth momentum [S4,S22]. Management prioritizes securing additional securitization transactions or new credit arrangements while monitoring counterparty credit risks.
Securitization Strategies and Financing Facilities as Growth Enablers
Ready Capital actively employs securitization vehicles as cornerstone long-term funding mechanisms particularly within the LMM commercial real estate segment where non-recourse asset-backed securities finance between half to nearly all costs depending on asset quality via performing ABS trusts or liquidating trusts dedicated to non-performing assets [S6]. CMBS/CDO-style tranches incorporate subordinate equity exposed to first loss arrangements.
Warehouse lines paired with repurchase agreement structures provide interim funding until qualifying pools accumulate enabling issuance of longer duration bonds at attractive spreads[S7,S14]. Interest rate derivatives hedge floating versus fixed spread mismatches between asset yields locked at origination pending securitization executions—streamlining yield preservation amid rising short-term rates[S5,S6].
Such structures provide flexibility allowing capital deployment across loan products while limiting exposure to funding cost volatility inherent within fragmented LMM lending markets.
Capital Allocation: Dividends, Buybacks, and Equity Movements
Ready Capital has maintained dividend distributions consistent with REIT qualification mandates despite pressures from shrinking equity bases.[F1] Annual dividends exceeded $113 million in FY2025 following higher payout years earlier reflecting priority given towards shareholder returns even amid tightened earnings metrics.[F1] Concurrently open-market share repurchases reached nearly $68 million during FY2025 after ramping up markedly from prior years—signaling confidence balanced against liquidity demands.[F1]
Return on equity remains modest near ~1.7% based on available data given large equity base relative to net income seen historically—the current environment coupled with elevated financing costs likely pressures earnings further signaling prudent capital conservation pending credit environment stabilization.[F1]
This balancing act illustrates management’s navigation between sustaining investor yields without sacrificing flexibility needed for opportunistic growth via expanded lending origination pipelines or selective acquisitions.[F1]
Risk Factors in Market Volatility and Interest Rate Hedging Practices
The company emphasizes vulnerabilities related primarily to liquidity due to maturing debts combined with inherent credit risks if macroeconomic conditions deteriorate leading to higher borrower defaults or losses.[S1 , S19] Inflationary impacts pose valuation challenges especially on longer-leased real estate collateral lacking rent escalators commensurate with inflation rates potentially compressing recoverable values.[S1] Geopolitical tensions adding cost pressures amplify these concerns impacting borrower solvency broadly.[N1]
Legal challenges compound risk landscape as ongoing securities-related class action lawsuits allege misstatements about loan performance potentially burdening financial condition depending on resolution outcomes.[S19]
Interest rate hedging mitigates spread volatility exposure but introduces contingent liabilities that may require cash payments if counterparties default or early termination events occur necessitating vigilant risk oversight.[S7 , S15]
Forward-Looking Considerations: Milestones and Market Dynamics
Key upcoming milestones revolve around management's ability to refinance or repay sizable senior secured notes due throughout calendar year 2026 pivotal given impact on liquidity position and operational continuity.[S4 , N2] Successfully closing additional securitization deals would unlock durable match-funded borrowing enabling new originations expansion particularly within high-margin SBA lending niches.[N1 , S6] Asset disposition outcomes affect book value stability—prices realized relative to carrying amounts will signal market reception.
Investor attention should focus on subsequent quarterly earnings releases where management updates on debt refinancing status, treasury cash balances trends, pipeline volume shifts across purchase/sale transactions along with prudential commentary related to derivative hedge adjustments provide directional clarity.[N1]
Overall model evolution emphasizes ongoing strategic pivot towards augmenting Small Business Lending alongside maintaining core LMM originations leveraging scalable securitization channels underpinning future revenue streams notwithstanding current tight capital market constraints.
Disclaimer: This analysis is based solely on publicly available information as of March 3, 2026. It is intended as an informative summary without providing investment advice or recommendations.
Disclaimer: This is research-only, informational analysis and not investment advice. It may include AI-generated interpretation and general industry context. Always verify important details using primary sources.

Comments