
Smith-Midland Corp Records Accelerated Growth Fueled by Barrier Rental Demand
Strong 2025 revenue and earnings growth driven by proprietary precast products and expanding barrier rental operations.
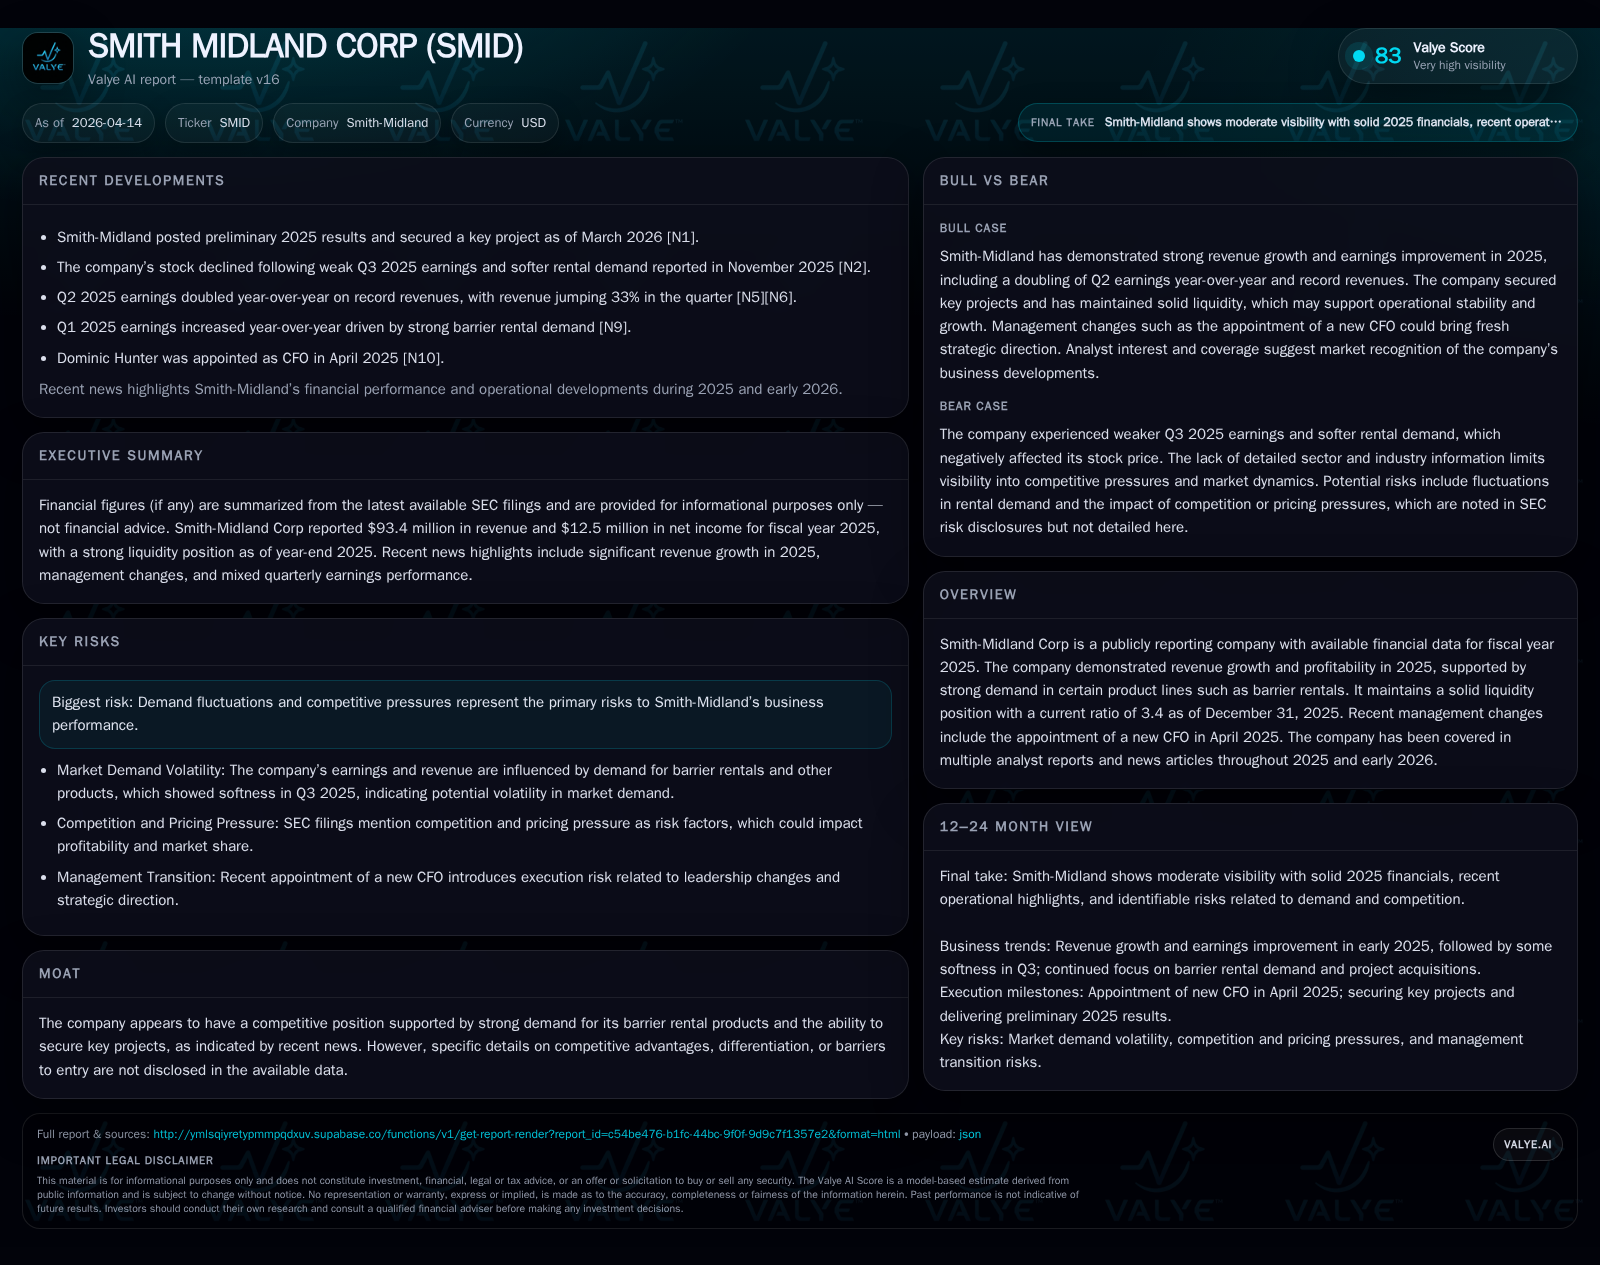
Smith-Midland Corp delivered robust financial performance in fiscal 2025, marked by a 19% increase in revenue to $93.4 million and a 62.9% jump in net income to $12.5 million, underpinned by high-margin barrier rentals and innovative product lines. The company’s solid liquidity position with a current ratio of 3.4x and strategic capital allocation reflects operational discipline amid rising demand across key U.S. infrastructure markets. Key contract wins with transportation authorities provide revenue visibility, while risks include demand cyclicality and competitive pressures.
2025 Surge: Revenue and Earnings Momentum Breakdown
Smith-Midland Corp experienced significant acceleration in financial performance during fiscal year 2025. Revenues climbed approximately 19%, reaching $93.4 million compared to $78.5 million in the prior year, reflecting strengthened demand for both product sales and barrier rental services [F1][N1]. Operating income posted an even more substantial gain of nearly 72%, rising to $17.0 million from $9.9 million in 2024, demonstrating meaningful operating leverage especially within the barrier rental segment where utilization rates have expanded alongside infrastructure project flows [F1][N1]. Net income increased over 62% to $12.5 million.
This improvement highlights how scalability inherent in the rental business—characterized by relatively fixed overheads matched against growing rentals—has amplified profitability. Higher utilization rates of highway safety barriers boost top-line revenues and positively impact gross margin profiles due to the capital-light recurring revenue model.
Core Product Lines and Market Reach: Strengths Driving Demand
Smith-Midland’s portfolio centers on patented precast products tailored for regional infrastructure markets spanning the Mid-Atlantic, Northeastern, Midwestern, and Southeastern U.S. Flagship offerings include SlenderWall®, a lightweight concrete-steel hybrid exterior cladding panel designed for energy-efficient commercial construction; J-J Hooks®, a crash-tested highway safety barrier system; SoftSound™, a sound-absorptive finish enhancing noise mitigation solutions; Sierra Wall™, tailored roadside noise barriers; and modular transportable concrete buildings under Easi-Set® brands [S1].
These products are protected by patents, trademarks, federal crash tests, and state approvals that differentiate their competitive positioning. Licensing agreements generate steady fee income alongside direct manufacturing sales [S1]. The product breadth across building construction, highways, utilities, and farming sectors enables demand diversification despite core strength in public infrastructure projects executed primarily through general contractors serving government transportation authorities.
Latest Project Wins and Strategic Implications
Recent announcements highlight Smith-Midland’s success securing key projects within core markets [N1]. These multi-year engagements with federal or state Departments of Transportation enhance visibility into recurring barrier rental income streams while reinforcing relationships critical for pipeline renewal.
Such projects involve intensive use of safety barriers during road expansions or maintenance shutdowns. Contract tenures align with infrastructure build-out timelines providing predictable utilization horizons that support asset turnover optimization strategies. Customer preference for certified systems like J-J Hooks® remains central to retention.
Liquidity and Capital Structure: Balance Sheet Highlights
The company maintains a strong liquidity profile entering 2026 with a current ratio of approximately 3.4x as of December 31, 2025—current assets around $48.7 million versus current liabilities near $14.3 million [F1]. This cushion reflects prudent working capital management aligned with contract-backed receivables cycles typical in construction industries.
Appointment of Dominic L. Hunter as CFO in April 2025 correlates with focused capital structure adjustments including optimized payables timing and controlled inventory levels documented in quarterly filings [S6][S11]. Cash balances remain robust facilitating financial flexibility for opportunistic capex or strategic investments.
Returns Analysis: ROE, Cash Flow Generation, and Capital Spending
Smith-Midland’s return on equity approximates an impressive 23% based on net income relative to shareholders’ equity totaling $54.3 million at end-2025 [F1]. These returns reflect improved profit margins from operating leverage in rentals alongside efficient capital use.
Operating cash flow surged over 177% year-over-year reaching $14.3 million driven by earnings quality improvements combined with favorable working capital trends after prior years of negative or flat cash flows [F1]. Capital expenditures rose moderately about 50% to $9.3 million supporting capacity expansion and innovation efforts including tooling enhancements for SlenderWall®. Free cash flow was positive at approximately $4.96 million (CFO minus capex), underscoring disciplined investment without compromising liquidity.
Growth Outlook: Company Insights and Risks
Management highlights growth potential within the barrier rental market through fleet expansion targeting higher utilization rates coupled with selective acquisitions or partnerships aligned with municipal transportation budgets [N1][S2]. Innovation pipelines for proprietary coatings and modular buildings signal incremental licensing opportunities.
Risk disclosures emphasize sensitivity to cyclical fluctuations in public infrastructure spending influenced by regulatory frameworks, budget allocations, and political priorities [S4]. Competitive pressures from alternative providers or material substitutes could constrain pricing power limiting margin expansion.
Key Performance Indicators for Monitoring
Analysts should track utilization rates within the barrier rental fleet impacting recurring revenue quality; win rates on transportation authority tenders indicating mid-term backlog health; incremental gross margins on flagship products revealing cost containment effectiveness; and compliance metrics related to debt covenants illustrating balance sheet robustness post-CFO transition [S1][S2]. Seasonality tied to weather-dependent construction schedules alongside regional funding cycles influences KPI volatility.
Conclusion: Sustainable Competitive Positioning Assessment
Smith-Midland demonstrates strong operational momentum fueled by proprietary precast innovations combined with scaling barrier rental operations yielding robust returns and liquidity strength [F1][S1]. Patent protection creates helpful entry barriers supporting premium pricing within segmented government contracts.
Recent CFO-driven capital discipline enhances ability to self-finance growth while sustaining free cash flow necessary for reinvestment or shareholder returns. However, persistent risks from demand cyclicality and emerging competitors require ongoing vigilance regarding differentiation beyond intellectual property alone.
Overall, Smith-Midland’s blend of innovative product IP complemented by reliable government transportation demand positions it well for profitable expansion amid complex infrastructure ecosystems.
Smith-Midland Historical Financial Performance Metrics (FY2022-FY2025)
Historical performance (annual)
| FY | Rev ($mm) | Net ($mm) | CFO ($mm) | OpInc ($mm) | Rev YoY | Net YoY |
|---|---|---|---|---|---|---|
| 2025 | 93 | 13 | 14 | 17 | +19.0% | +62.9% |
| 2024 | 79 | 8 | 5 | 10 | +31.8% | +865.4% |
| 2023 | 60 | 1 | 8 | 1 | +18.8% | -0.6% |
| 2022 | 50 | 1 | -6 | 1 |
Source: SEC companyfacts cache [F1].
Capital returns and efficiency (annual)
| FY | FCF ($mm) | ROE% |
|---|---|---|
| 2025 | 5 | 23.0 |
| 2024 | -1 | 18.4 |
| 2023 | 3 | 2.3 |
| 2022 | -9 | 2.4 |
Source: SEC companyfacts cache [F1].
Disclaimer: This is research-only, informational analysis and not investment advice. It may include AI-generated interpretation and general industry context. Always verify important details using primary sources.
Comments