
Steel Dynamics’ Integrated Model Challenges Commodity Headwinds
Record shipment volumes propelled revenue growth, while metal spread compression pressured earnings in 2025.
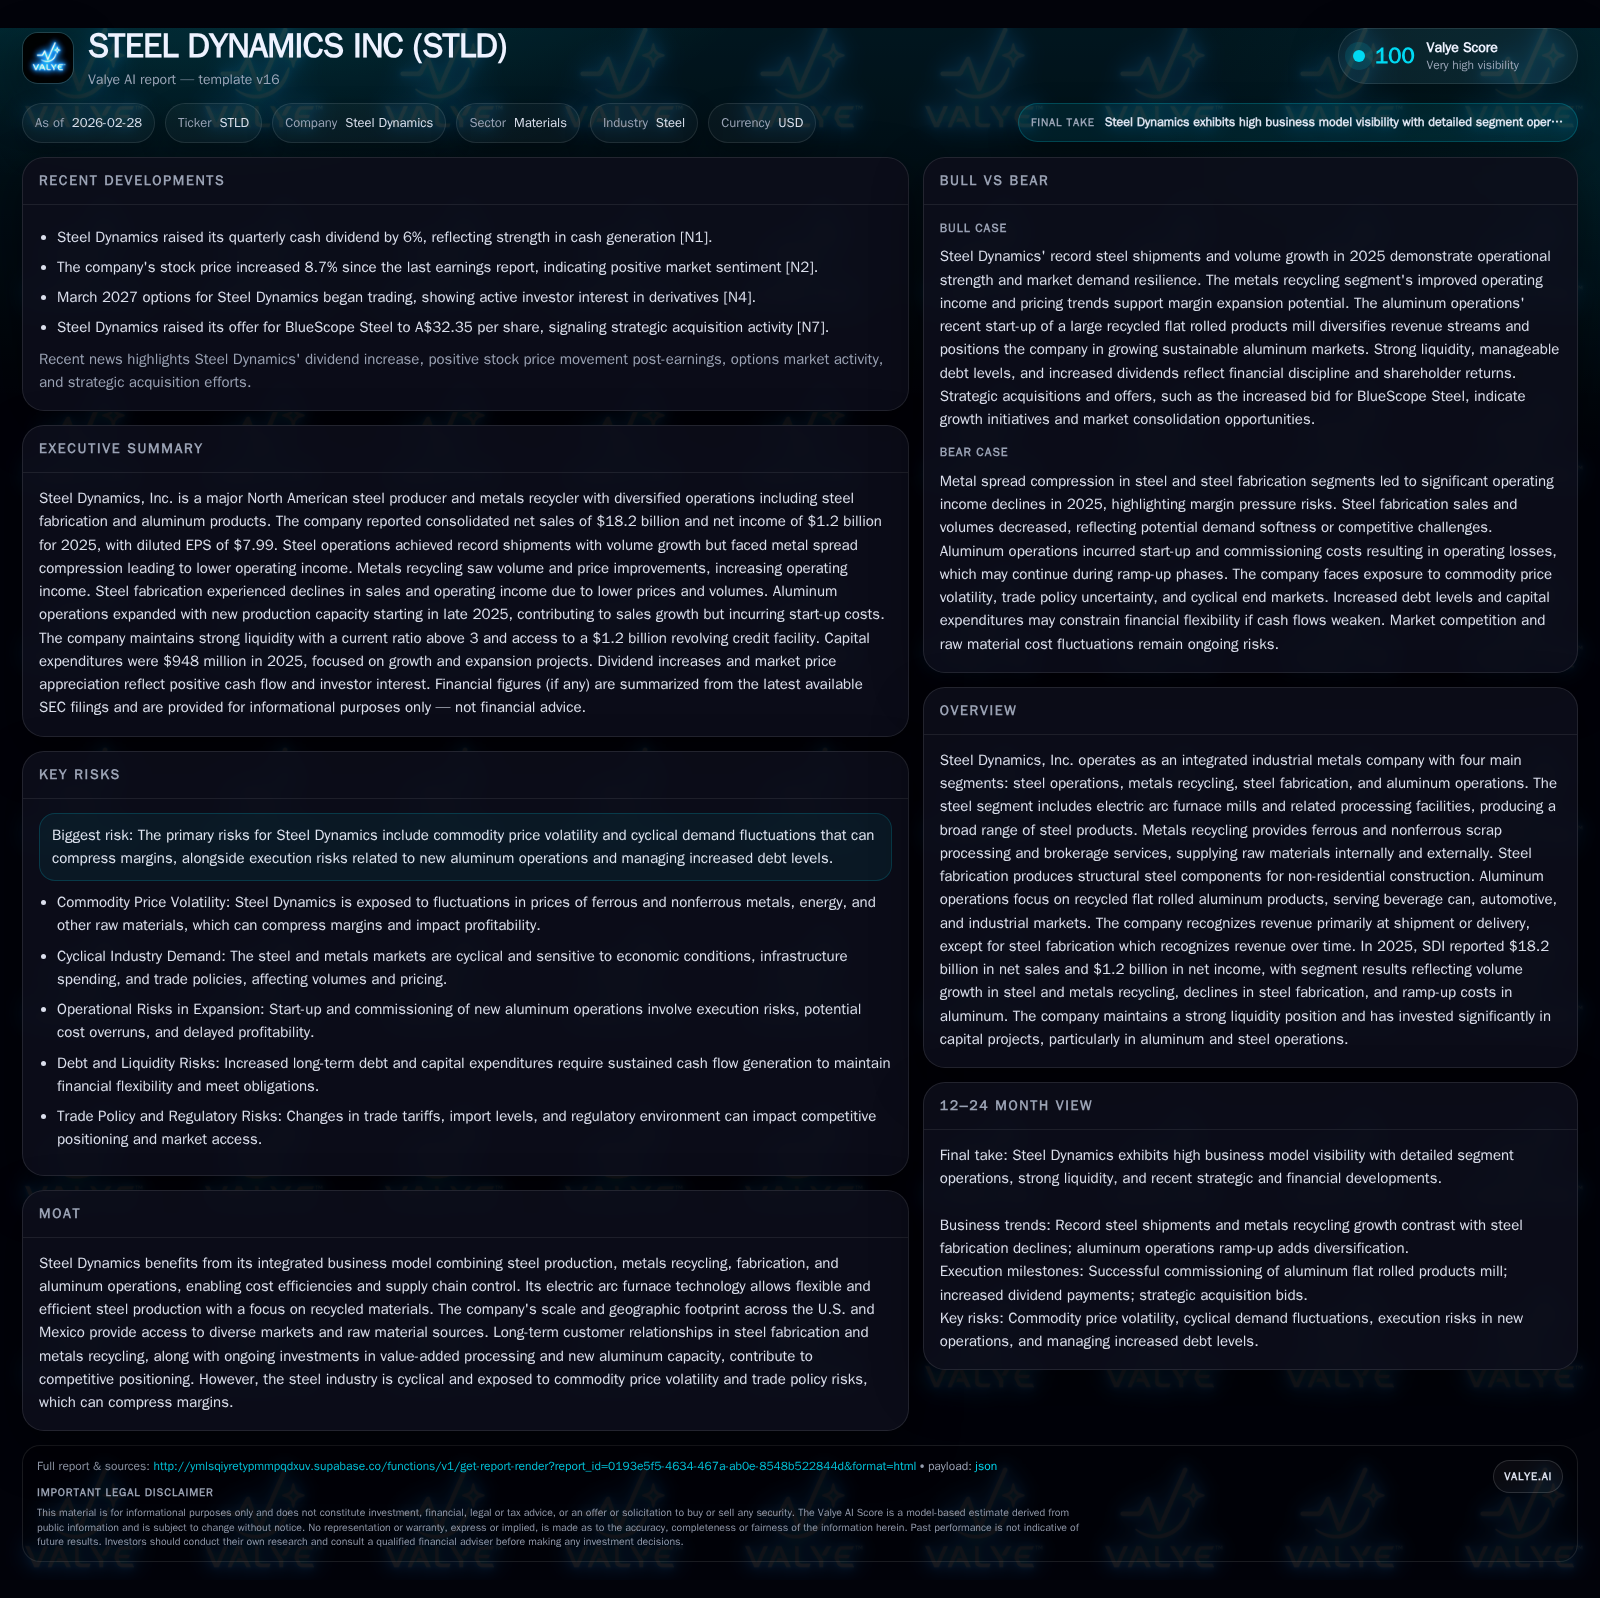
In 2025, Steel Dynamics Inc. achieved record steel shipments of 13.7 million tons, contributing to a 20.9% increase in consolidated revenue to $18.2 billion [F1][S1]. Despite volume gains, the company faced significant metal spread compression impacting operating income, which fell by 24% year-over-year to $1.5 billion [F1][S1]. Its integrated business model—spanning steel production, metals recycling, fabrication, and aluminum operations—provides cost and supply chain advantages that support resilience amid cyclical commodity pressures [valye_report_excerpt][S1]. The aluminum segment successfully ramped up recycled flat rolled products with key quality certifications during the second half of 2025 [S1]. Capital discipline manifested through robust liquidity totaling over $2.2 billion [S6], sustained dividend growth, and $900 million in share repurchases despite modest cash flow contraction [F1][N1][S9]. Going forward, market demand stability, cost management, and aluminum expansion execution are critical to navigating steel’s inherent cyclicality and spread volatility [valye_report_excerpt][N2].
2025 Revenue and Profit Shifts Reflect Steel Market Dynamics
Steel Dynamics (STLD) delivered record physical shipment volumes of 13.7 million tons of steel during fiscal year 2025, which supported a substantial advance in consolidated revenue to $18.2 billion—up approximately 20.9% compared to the prior year [F1][S1]. This volume growth stemmed from stable underlying domestic steel demand coupled with declines in import competition during the year’s second half as well as operational improvements within its Sinton Flat Roll Division [S1]. Metals recycling also displayed improved operating income propelled by higher processing volumes and favorable ferrous/nonferrous price realizations.
Despite this top-line strength, STLD faced material profitability headwinds as metal spread compression—a narrowing between selling prices and raw material costs—adversely affected steel operations and more markedly the steel fabrication segment. Consequently, consolidated operating income declined by about $467 million or close to 24% from $1.9 billion in 2024 to $1.5 billion in 2025; net income attributable to Steel Dynamics decreased nearly 23% to approximately $1.2 billion; diluted EPS followed this drop from $9.84 down to $7.99 per share [F1][S1]. This divergence illustrates the dichotomy between volume-driven growth versus margin pressure tied closely to commodity pricing volatility.
Historical performance (annual)
| FY | Net ($bn) | CFO ($bn) | OpInc ($bn) | Capex ($mm) | Net YoY |
|---|---|---|---|---|---|
| 2025 | 1.2 | 1.4 | 1.5 | 948 | -22.9% |
| 2024 | 1.5 | 1.8 | 1.9 | 1868 | -37.3% |
| 2023 | 2.5 | 3.5 | 3.2 | 1658 | |
| 2022 | 4.5 | 5.1 | 909 |
Source: SEC companyfacts cache [F1].
Capital returns and efficiency (annual)
| FY | Buybacks ($mm) | FCF ($bn) | ROE% |
|---|---|---|---|
| 2025 | 901 | 0.5 | 13.2 |
| 2024 | 1212 | -0.0 | 17.2 |
| 2023 | 1452 | 1.9 | 27.6 |
| 2022 | 1801 | 3.6 |
Source: SEC companyfacts cache [F1].
*Note: Prior year figures are referenced comparatively but not tabulated here.
Integrated Operations: The Cost and Supply Chain Advantage
Steel Dynamics' competitive moat rests heavily on its integrated platform encompassing four core segments: steel operations utilizing electric arc furnace (EAF) technology, metals recycling that feeds internal production needs while servicing external scrap markets, steel fabrication generating structural components for non-residential construction with distinctive revenue recognition over project timelines, and expanding aluminum operations focused on recycled flat rolled product lines [S1].
The EAF-based steel production offers cost efficiency advantages over conventional blast furnaces due to flexibility in using recycled scrap inputs—a key factor given scrap represents the largest direct component of cost of goods sold including alloys, energy inputs like electricity/natural gas, labor costs, and transport expenses [S1]. This integration allows for tighter control over raw material sourcing through metals recycling operations that improve margin resilience amidst input price swings.
Furthermore, the fabrication segment employs an output-based revenue recognition method reflecting completed fabricated tons relative to contract size rather than point-in-time shipment recognition common in steel operations or aluminum sales. This leads to different revenue timing but stabilizes cash flows across multi-period contractual projects [S14][S19].
The nascent aluminum operation—commencing production mid-2025—capitalizes on recycled materials expertise extended into producing flat rolled aluminum products certified for demanding segments such as beverage cans and automotive skins; these certifications are critical milestones unlocking commercial scale shipment capability aimed at diversifying revenue streams beyond traditional ferrous metals markets [S1].
Underlying Volume Growth vs. Price and Margin Compression
Volume momentum was strong across segments with approximately flat domestic demand underpinning steady consumption rates while import-related pressures eased from early-year peaks [S1]. Metals recycling benefitted from higher pricing trends globally for scrap commodities alongside volume expansion.
However, persistent compression of metal spreads—representing the differential between product selling prices and corresponding input costs such as scrap alloys—sharpened adverse margin trends especially for steel fabrication where price moderation took hold later in the year before stabilizing by Q4 [S1]. Such pressure translated into nearly one-quarter lower operating profits despite top-line advancements which also influenced net earnings contraction.
This dynamic highlights operational leverage: volume scale drives revenue gains; yet margins remain sensitive given high exposure to volatile commodity inputs partially hedged through base metal financial contracts (with unrealized mark-to-market losses reported at approximately $56 million expected to settle within the subsequent year) [S16][F1].
Emerging Aluminum Segment: Capacities and Qualification Milestones
STLD's strategic push into aluminum recycling materialized notably during H2 of fiscal year ‘25 with commissioning activities culminating in initial shipments from its newly established flat rolled recycled aluminum mill located in Columbus, Mississippi [S17]. Satellite slab centers catering to Central Mexico and Southwestern US regions are under development or recently completed.
Industrial acceptance was affirmed via successful qualification of products delivering requisite quality standards for beverage packaging applications as well as automotive-grade coatings—a critical aspect given stringent specifications around weight reduction combined with thermal performance in automotive sheet panels [S17][S24]. These validations facilitate penetration into diverse end-markets providing growth avenues outside volatile ferrous segments.
Inventory buildup increased substantially by nearly $625 million driven primarily by this aluminum segment's ramp-up stage requiring working capital investment ahead of steady-state production returns [S7], aligning with capital allocation plans focusing nearly $950 million of property plant & equipment expenditures mostly targeting growth investments within aluminum plus continuing modernization efforts inside steel units [F1][S24].
Capital Structure: Noteworthy Debt Issuance and Covenant Compliance
Capital structure management remained disciplined amid sizable financing maneuvers involving issuance of multiple tranches of senior unsecured notes totaling approximately $1.8 billion across maturities spanning from 2028 through mid-century horizons—including notes at coupons ranging between ~4%-6%—used predominantly for redeeming maturing cheaper debt instruments ($800 million notes matured or redeemed) alongside funding general corporate needs tied partly to expansion projects [S4][S5].[F1]
Despite the debt increase raising total long-term obligations from around $3.2 billion at end-’24 to approximately $4.2 billion at end-’25—the company maintained strong credit metrics with an interest coverage ratio measured above 13x (EBITDA-to-interest expenses) and a conservative debt-to-capitalization ratio near one-third (0.32), comfortably within covenant limits stipulated by revolving credit agreements expiring mid ‘28 allowing additional borrowings subject to conditions up to $500M beyond existing facility ceiling [$1.2B revolver currently undrawn] [S6][S7].[F1]
This conservative profile signals operational resilience supporting ongoing investment programmes while safeguarding refinancing flexibility.
Capital Allocation Priorities: Dividends and Share Repurchases
STLD demonstrated an emphasis on returning capital steadily despite net income moderation by increasing quarterly dividends roughly 6%-9%, reaching annual declared payouts near $294 million during FY25 compared against ~$284 million previously; dividend boosts reflect confidence in sustainable cash flows even as operating cash flow contracted circa -21% year-over-year due mainly to working capital build related partly to metals inventory accumulation for aluminum ramp-up purposes [N1][F1][S25].[N7]
Simultaneously, share repurchase programs continued actively amidst this backdrop buying back about $900 million worth of stock shares (~6.7 million shares) compared to over a billion dollar repurchases prior years—a deployment calibrated alongside opportunity cost assessments rather than financial engineering emphasizing enhanced shareholder returns anchored by free cash flow generation capability rather than debt leverage increments alone confirming a balanced framework between growth reinvestment capacity vs direct shareholder remuneration priorities [F1][S9].[N7]
Liquidity Position Supports Investment and Financial Flexibility
Steel Dynamics ended fiscal year ‘25 with robust liquidity reserves aggregating approximately $770 million cash & equivalents supplemented by full revolver availability topping around $1.2 billion signaling readily accessible funding sources supporting operational funding needs alongside significant capex plans nearing nearly one billion dollars largely earmarked for sustained modernization plus enabling new product capacities primarily concentrated within the aluminum footprint as well as maintenance upgrades inside steel segments ensuring competitive positioning going forward [F1][S6].[N7]
Working capital cycles expanded as accounts receivable increased about $265 million reflecting higher sales activity levels while inventories ballooned mainly driven by initial raw material stock builds within newly commissioned aluminum plants underscoring deliberate front-loaded investments consistent with phased commercial scale strategies aimed at capturing longer term value creation potentials despite near-term profitability variances attached thereto [S7].[F1]
This liquidity cushion combined with covenant-compliant credit metrics creates a firm foundation affording STLD adaptability amid cyclical fluctuations characteristic of metals industries allowing measured execution paths balancing growth investments alongside prudent risk management safeguards.
Outlook Indicators: What to Watch in Market Demand, Pricing, and Costs
Looking ahead several critical indicators warrant close monitoring including: domestic demand trajectories given historical cyclicality seen across infrastructure/construction aggregates influencing order patterns; metal spread dynamics which have proven decisive drivers behind operating margin fluctuations necessitating ongoing management via commodity contracts albeit limited hedge effectiveness under extreme price moves; successful ongoing scaling of aluminum capacities dependent on continuous throughput optimization plus customer qualifications expanding downstream penetration particularly within beverage can/automotive sectors; leverage vigilance sustaining robust interest coverage amid incremental debt assumptions; alongside macro trade policy developments that could alter import/export flows affecting market supply-demand balances altering pricing fundamentals highlighted within recent risk disclosures explicitly citing volatility exposure inherent within raw materials procurement coupled with tariff/regulatory uncertainties impacting margin stability prospects over time intervals commensurate with capital recovery horizons (,[N2]).
Collectively these variables compose a complex interplay shaping Steel Dynamics’ medium-term performance profile requiring adaptive operational controls reflecting ongoing commodity cycle navigation paired with integrated business strategy advantages yielding durable competitive moats amidst periodic headwinds typical of the industrial metals space.
This analysis is based strictly on publicly available SEC filings dated through February 27th, 2026 ([F1],[S#]) plus select recent market news ([N#]) without forward-looking predictions or investment recommendations.
Disclaimer: This is research-only, informational analysis and not investment advice. It may include AI-generated interpretation and general industry context. Always verify important details using primary sources.
Comments