
THOR Industries Revises Outlook on Cyclical RV Demand and Capital Deployment
THOR Industries confronts earnings challenges linked to RV sector cyclicality while managing capital allocation prudently amid market uncertainties.
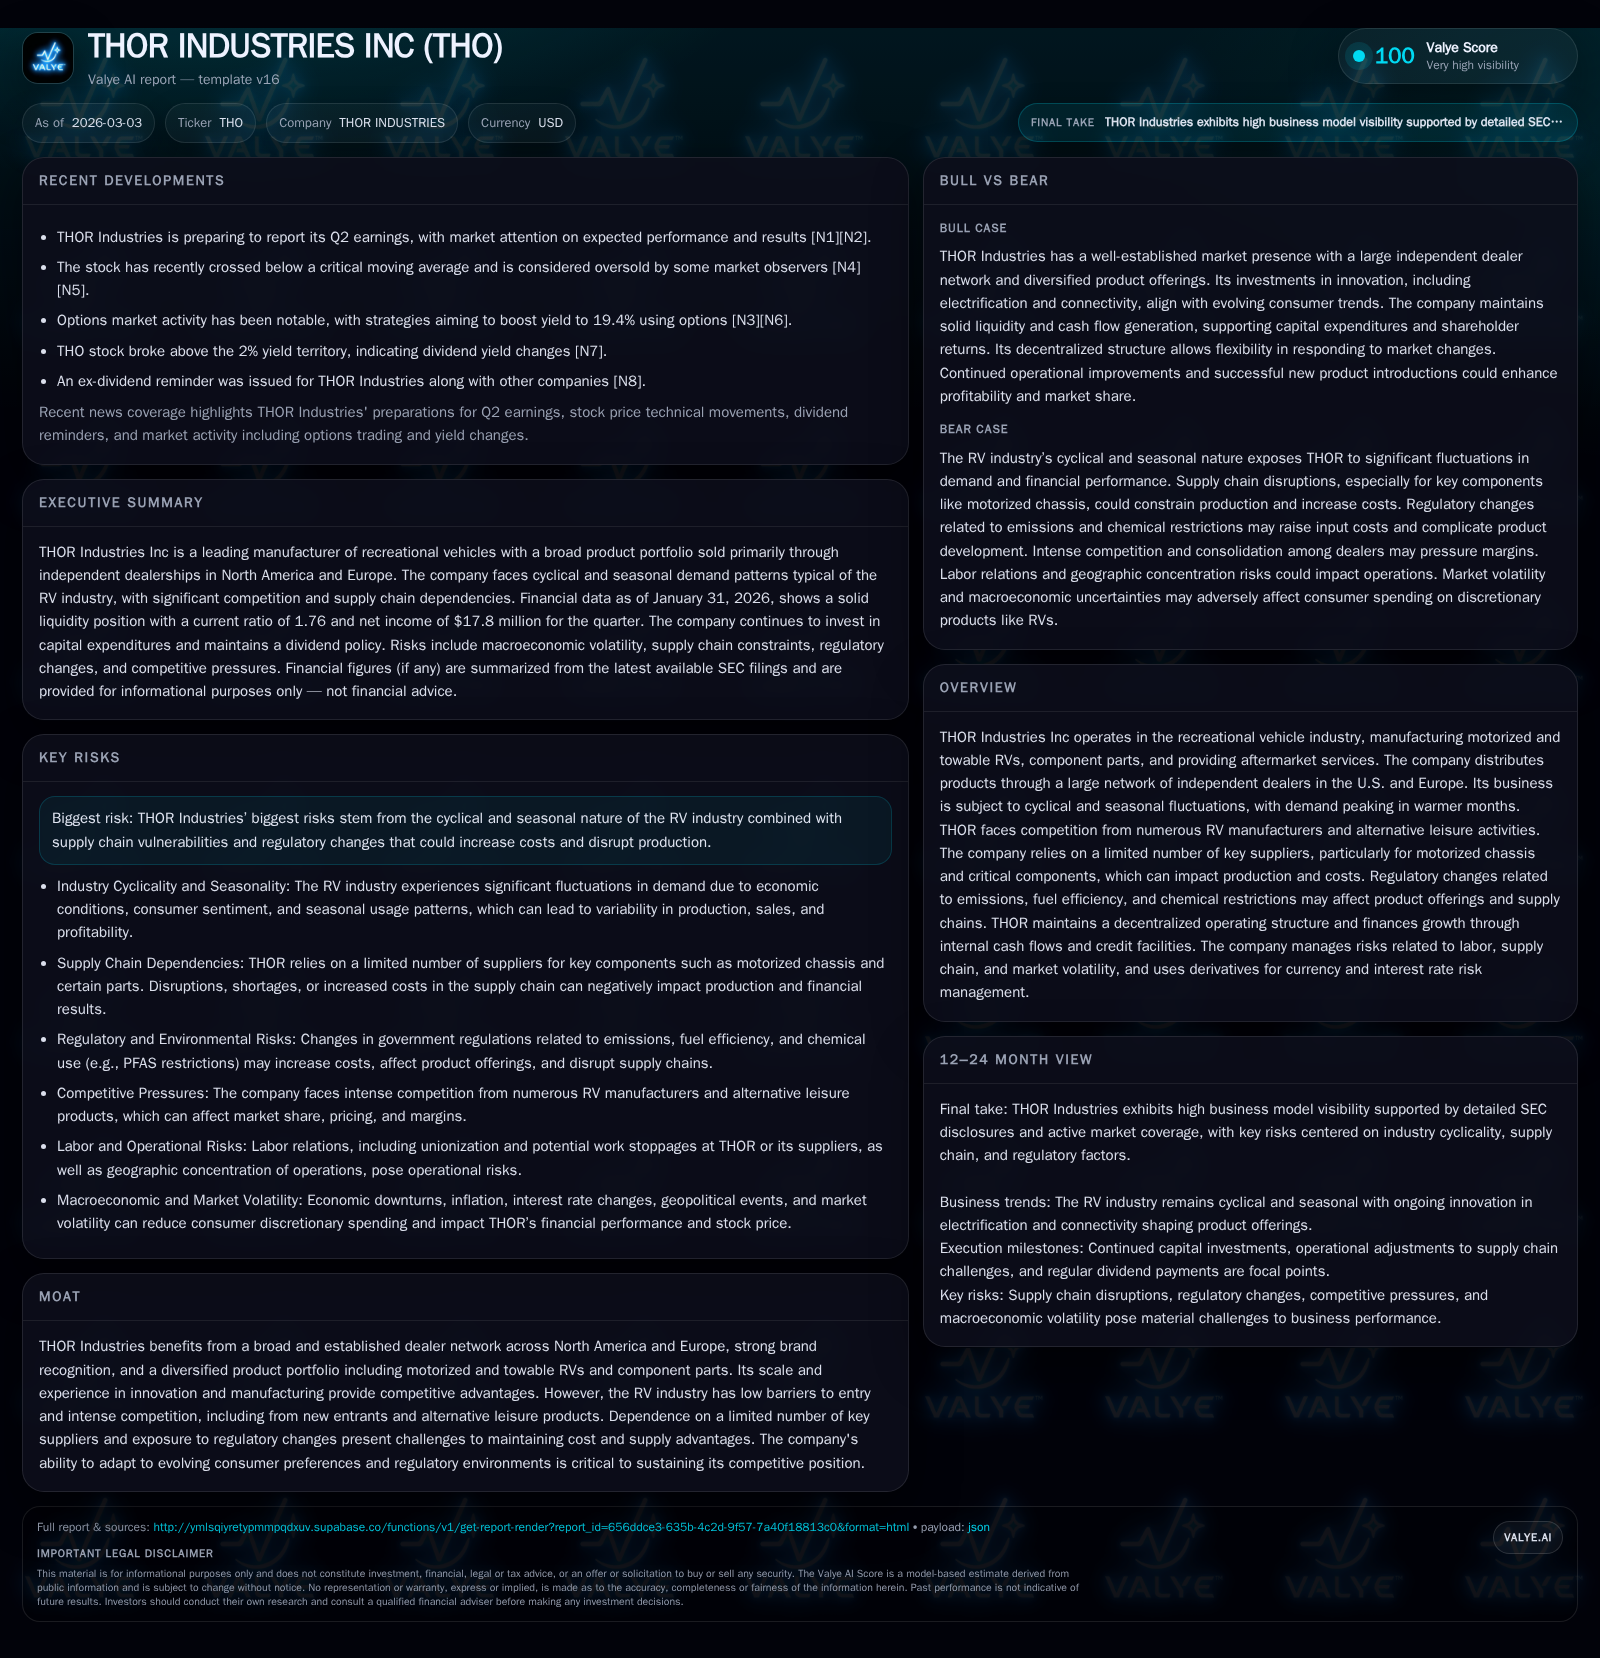
THOR Industries reported a modest decline in net income alongside steady operating cash flow growth, reflecting the seasonal and cyclical nature of the recreational vehicle (RV) market. The company’s diversified product portfolio and extensive dealer network underpin its competitive position but face headwinds from supply chain dependencies and regulatory pressures. Capital allocation remains balanced, with continued dividend payments and share repurchases, though buyback activity shows some conservatism amid demand fluctuations. Going forward, close scrutiny of production adjustments, supplier constraints, and upcoming earnings milestones is warranted given evolving consumer preferences and cost factors.
THOR’s Recent Performance: Cycles, Seasonality, and Profit Trends
THOR Industries reported a net income of approximately $258.6 million for fiscal year 2025 ending July 31, marking a -2.5% decline relative to $265.3 million in fiscal 2024 [F1]. Operating cash flow (CFO), however, grew by 5.9% to $577.9 million over the same period, indicating improved cash conversion even as profitability tightened [F1]. This divergence aligns with the inherently cyclical and seasonal characteristics of the RV industry discussed extensively in THOR’s annual report, where demand surges in warmer months create marked quarterly production swings [S1]. The company has struggled to fully offset margin pressure amid softer demand segments.
Capital expenditures increased meaningfully by over 20% year-over-year to support capacity enhancements aimed at operational flexibility — key for managing volatile order flows and rapidly adjusting production rates without excessive fixed cost burdens [F1][S1]. Such investments underscore THOR's strategic priority to remain responsive to fluctuating dealer orders amidst ongoing economic headwinds.
Historical Financial Summary FY2022-FY2025
Historical performance (annual)
| FY | Net ($mm) | CFO ($mm) | Net YoY |
|---|---|---|---|
| 2025 | 259 | 578 | -2.5% |
| 2024 | 265 | 546 | -29.1% |
| 2023 | 374 | 982 | -67.1% |
| 2022 | 1138 | 990 |
Source: SEC companyfacts cache [F1].
Capital returns and efficiency (annual)
| FY | Buybacks ($mm) | ROE% |
|---|---|---|
| 2025 | 53 | 6.0 |
| 2024 | 68 | 6.5 |
| 2023 | 42 | 9.4 |
| 2022 | 165 | 31.7 |
Source: SEC companyfacts cache [F1].
Note: Capex historical data beyond FY2018 not provided [F1]. Return on equity calculated as latest annual net income divided by equity at fiscal year-end [F1].
Evolving Market Drivers and Product Portfolio Influences
THOR's diverse product portfolio spans motorized RVs—both diesel and gasoline variants—and towable RVs including travel trailers and fifth wheels alongside aftermarket services, collectively shaping revenue streams across different consumer preferences and price points [S14]. Recent periods saw a higher volume concentration toward moderately priced gas units compared to premium diesel units which previously bolstered margins [S16]. Pricing leverage has been challenged due to increased discounting necessary to sustain volumes amid subdued consumer confidence driven by lingering inflationary pressures and elevated interest rates impacting retail financing availability [S17].
Supplier dependence remains a salient factor; critical chassis components sourced from a limited set of vendors constrain production ramp flexibility crucial during sudden demand shifts [S12]. These bottlenecks impact inventory management at independent dealers who represent an integral part of THOR's distribution system across North America (2,400 dealers) and Europe (1,100 dealers) [S14]. Dealer consolidation trends increase bargaining power risks affecting pricing structure and sales throughput [S24].
Liquidity, Debt Structure, and Interest Cost Dynamics
THOR Industries completed multiple amendments throughout fiscal years ending 2024-25 aimed at extending term loan maturities out to November 2030 while reducing applicable interest rate spreads on U.S.-dollar term loans (with SOFR margin down by 0.50%) and Euro-denominated loans (0.25% reduction) [S4][S5][S6]. These changes lowered weighted average borrowing costs significantly—the USD term loan interest rate dropped from 7.59% in July 2024 to ~6.61% as of July 2025—with no outstanding borrowings under the $1 billion asset-based revolving credit facility providing ample undrawn liquidity buffer ($840 million availability as of July 31, 2025) [S8][F1].
Mandatory prepayments linked to specified events such as asset sales or excess cash flows were not triggered recently; principal payments scheduled have been proactively satisfied ahead of schedule enhancing covenant compliance flexibility [S5]. Interest expenses remain a notable component but have moderated relative to prior periods reflecting both reduced debt balances (total long-term debt declining from ~$1.15 billion in FY2024 to ~$933 million in FY2025 after repayments) and favorable pricing terms [S10][F1].
Capital Allocation: Dividends, Share Repurchases, and Cash Flow Priorities
Consistent with prior years’ policy, THOR maintained its regular quarterly dividends at an elevated per-share payout of $0.50 beginning October 2024 from $0.48 previously; dividend sustainability depends on meeting debt facility-imposed conditions including minimum fixed-charge coverage ratios and adjusted excess cash metrics [S7][S9][F1]. The approximate return on equity stands near 6%, reflecting moderate profitability relative to equity base expansion [$258m net income / ~$4.29b equity] — underpinning measured capital return expectations [F1].
Share repurchase activity reflects cautious capital deployment: during fiscal 2025 about $52.6 million was spent buying back shares compared with $68.4 million in fiscal 2024 under existing board authorizations increasing up to $400 million effective June 2025 through July 2027 [S7][F1]. Management evaluates timing and amount based on market conditions, cash flow availability, and economic outlook — prudent given RV demand cyclicality pressures.
Free cash flow (operating cash flow less capex) approximated $440 million in FY2025 reflecting ongoing investment balanced against robust operating cash inflows supporting these capital returns without materially stressing liquidity positions [F1][S23].
Risks on the Radar: Supply Chain, Regulatory Shifts, and Competitive Pressures
Supply chain fragility emerges as a persistent risk particularly related to sole-source or concentrated suppliers of essential motorized chassis components capable of constricting production scalability during peak seasons or demand spikes — a vulnerability compounded by ongoing geopolitical trade uncertainties across U.S.-Europe corridors [S12][S21].
Regulatory landscapes impose additional cost layers including emerging emissions standards along with vehicle length/weight restrictions necessitating continual product redesign efforts raising compliance expense burdens; these factors can reduce operational margins unless effectively managed via innovation or supplier negotiation leverage [S12][S13].
Industry low entry barriers combined with accelerated dealer consolidations amplify competitive intensity while alternative leisure products vie for consumer discretionary spending; this dynamic requires continual brand vitality preservation supported by quality control amid recall risks that may adversely affect reputation or result in material warranty expense volatility [S26][S29].
What to Watch: Upcoming Earnings Milestones and Industry Signals
Market attention focuses strongly on Q2 fiscal 2026 earnings announcement expected shortly after January-end reporting per recent news coverage highlighting broadly cautious analyst sentiment around revenue growth trajectories given persistent macroeconomic headwinds impacting end-consumer willingness to commit discretionary capital for leisure vehicles [N2][N3]. Key metrics include retail sales velocity, dealer inventory turnover rates signaling demand strength or softness, gross margin stabilization especially within motorized unit mix shifts, as well as commentary around supply chain remediation progress.
Forward guidance clarity—if provided—on production rate adjustments or capital expenditure plans will be closely parsed for signals regarding management’s confidence level navigating these volatile conditions.
Conclusion: Strategic Flexibility in an Unstable Recreational Vehicle Market
THOR Industries exemplifies a seasoned player leveraging scale advantages through a wide-reaching independent dealer footprint combined with diversified RV product lines that collectively form barriers against fragmented competition despite low industry entry obstacles. Recent financial results reflect friction between cyclical industry forces compressing near-term earnings yet operating cash flows remaining resilient due primarily to internal working capital improvements.
Proactive refinancing efforts extending maturities while reducing effective interest costs enhance financial flexibility enabling calibrated capital returns including stable dividends alongside measured share repurchases consistent with conservative stewardship norms appropriate for an inherently volatile sector.
Looking forward, sustaining competitive advantage rests heavily on dynamic operational responsiveness—quickly scaling production up or down—to evolving wholesale order patterns without incurring disproportionate fixed overhead risks coupled with navigating increasingly complex regulatory demands requiring innovation and supply chain resilience.
Investors should keep close watch on upcoming operational updates focusing on order backlog health, supplier status reports especially chassis availability constraints, margin trajectory under shifting product mixes plus any shifts in board-level capital allocation policies reflective of underlying confidence amid prevailing market ambiguity.
Disclaimer: This analysis synthesizes publicly available SEC filings ([F1], [S#]) and news reports ([N#]) without offering investment recommendations.
Disclaimer: This is research-only, informational analysis and not investment advice. It may include AI-generated interpretation and general industry context. Always verify important details using primary sources.

Comments