
Treace Medical Concepts' Growth Moderates Amid Persistent Losses and Patent Litigation
Treace Medical Concepts advances its foot and ankle medical device sales with steady revenue gains but faces ongoing net losses and debt covenant pressures.
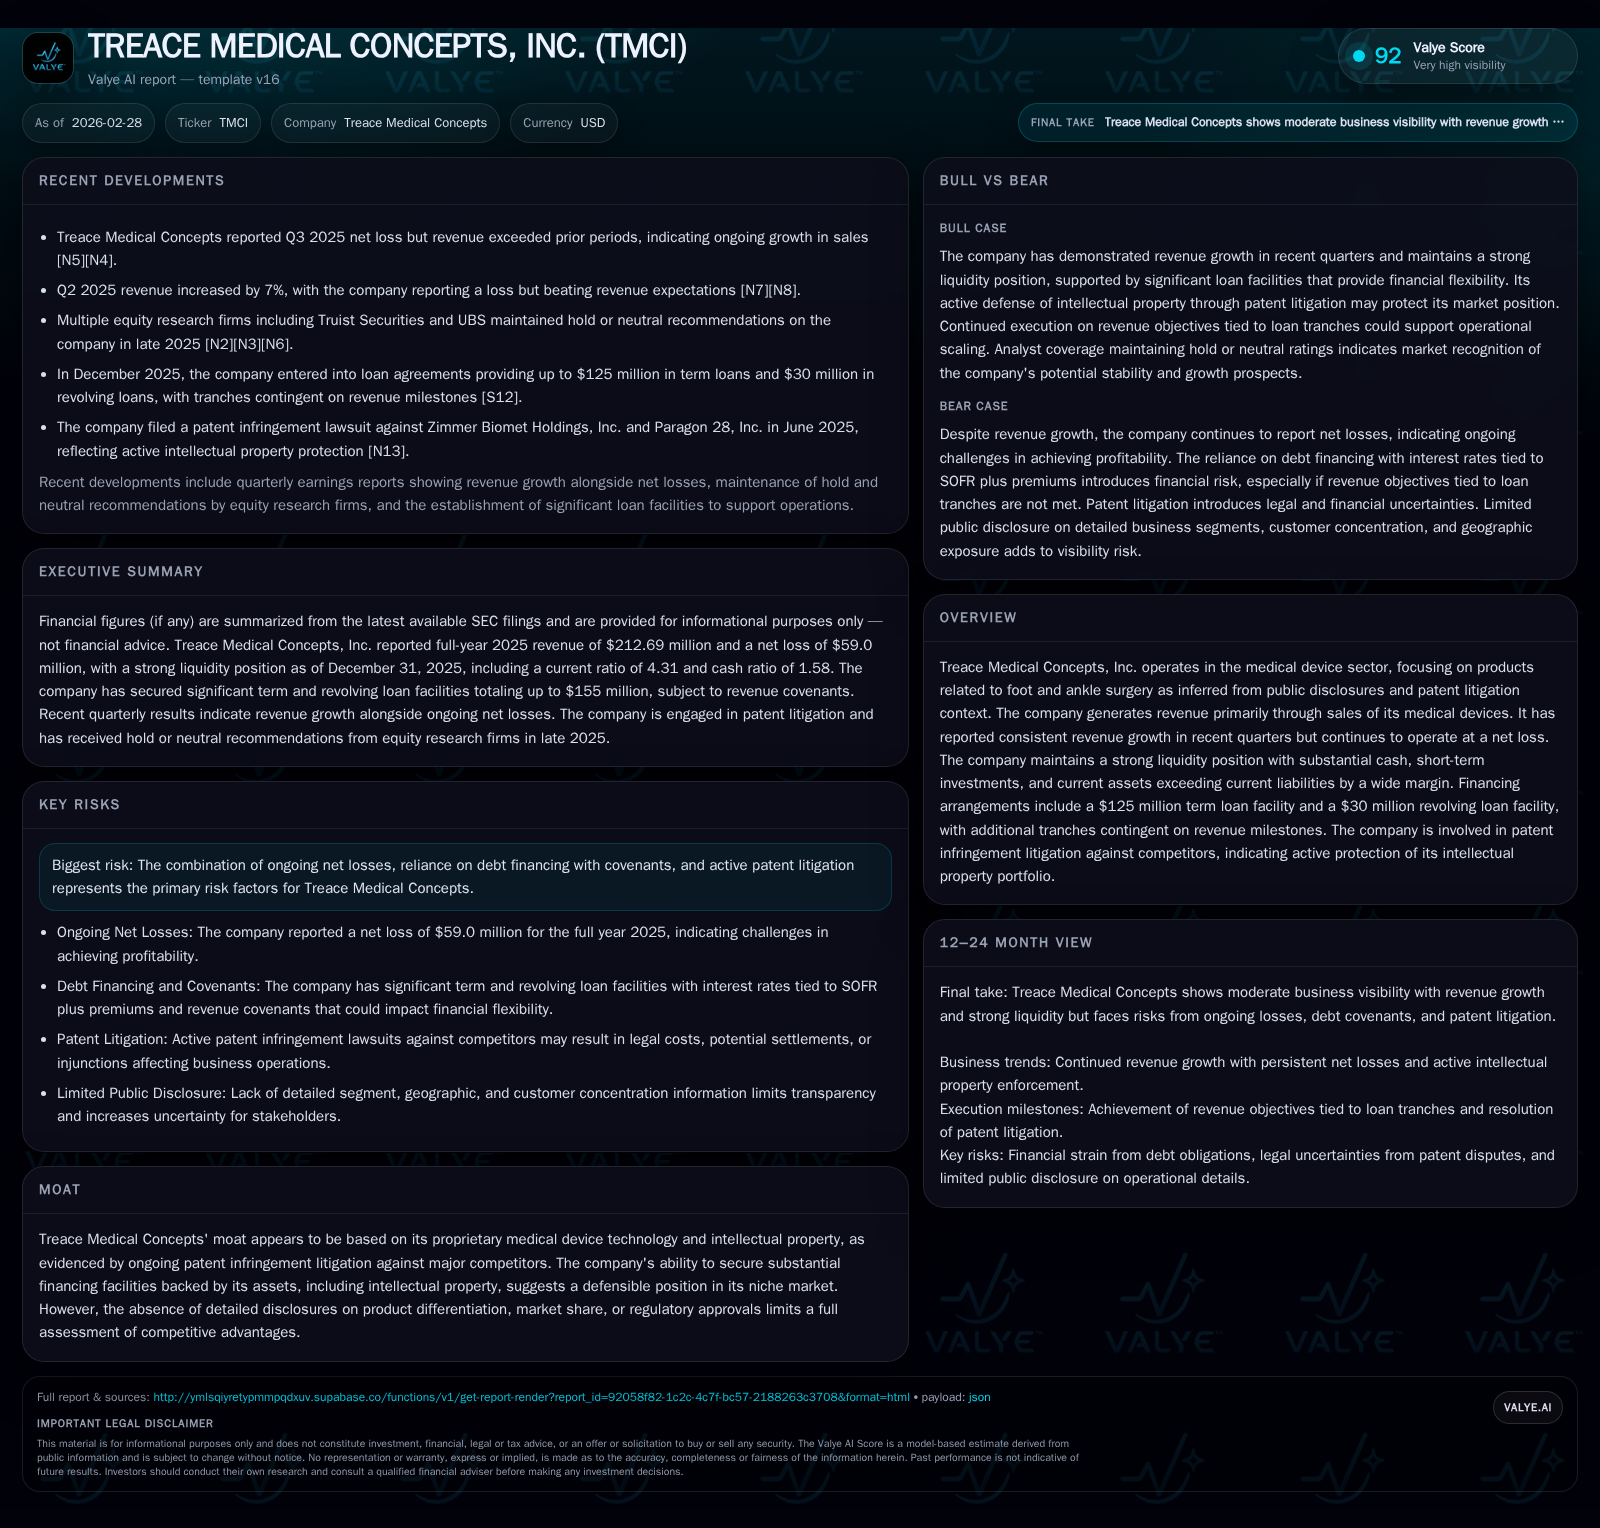
Treace Medical Concepts, specializing in foot and ankle surgery devices, demonstrated continued top-line growth reaching $213 million in fiscal 2025, up 1.6% year-over-year. Despite expanding revenue, the company remains unprofitable with a net loss of $59 million and negative operating cash flow, reflecting significant investment and commercialization costs. Treace maintains a strong liquidity position supported by sizable cash reserves and access to a $125 million term loan facility, though debt covenants require careful financial management. The company's moat relies heavily on patent-protected technologies actively defended in litigation against competitors, representing both a strategic asset and potential risk factor going forward.
Company Overview
Treace Medical Concepts, Inc. operates predominantly within the medical device segment targeting foot and ankle surgical solutions. The company’s portfolio centers on proprietary devices designed to address complex orthopedic conditions. Its moat is largely built upon intellectual property protections; Treace actively enforces patents through litigation against competitors broadly engaged in this niche [S1][S4].
Historical Performance and Growth Drivers
Over the last four fiscal years ending December 31, 2025, Treace has delivered consistent revenue growth as follows:
Historical performance (annual)
| FY | Rev ($mm) | Net ($mm) | CFO ($mm) | OpInc ($mm) | Rev YoY | Net YoY |
|---|---|---|---|---|---|---|
| 2025 | 213 | -59 | -16 | -54 | +1.6% | -5.8% |
| 2024 | 209 | -56 | -37 | -56 | +11.9% | -12.6% |
| 2023 | 187 | -50 | -35 | -51 | +31.9% | -15.7% |
| 2022 | 142 | -43 | -31 | -35 |
Source: SEC companyfacts cache [F1].
Capital returns and efficiency (annual)
| FY | FCF ($mm) | ROE% |
|---|---|---|
| 2025 | -29 | -67.6 |
| 2024 | -49 | -49.4 |
| 2023 | -46 | -35.9 |
| 2022 | -45 | -70.7 |
Source: SEC companyfacts cache [F1].
(Figures sourced from SEC filings [F1])
The upward revenue trajectory evidences growing surgeon adoption of Treace’s platforms during an orthopedic device market increasingly favoring minimally invasive procedures targeting hallux valgus (bunions) and associated conditions—areas where Treace enjoys patent advantages [S6]. However, substantial operating losses have persisted owing primarily to investments in product development, sales infrastructure expansion, and clinical education initiatives critical for disrupting entrenched treatment paradigms.
Notably, operating cash flow improved significantly in the latest year (-$16M in FY25 vs -$37M in FY24), suggesting better operational leverage as sales scale albeit still negative given elevated capex outlays supporting manufacturing capacity upgrades and R&D pipeline progress [F1][S13].
Financial Position and Capital Structure
At December 31, 2025, Treace held $10.7 million of cash and equivalents with current assets totaling approximately $132 million against current liabilities near $30 million — this translates to a current ratio exceeding 4x underscoring solid near-term liquidity [F1]. Extended liquidity support derives from:
- A committed five-year term loan facility totaling up to $125 million available in four tranches, with an initial drawdown of $60 million completed at closing.
- A separate revolving credit line of $30 million backed by accounts receivable and inventory.
- Interest rates pegged to SOFR plus a spread: term loan at SOFR +5.05%, revolver at SOFR +4%, with adjustment floors ensuring minimum effective rates [S5][S14].
These loan agreements impose financial covenants tied to maintaining minimum liquidity thresholds or achieving specific revenue milestones—failure of which could restrict financial flexibility or trigger repayment acceleration [S9][S12]. Treace prepaid prior loans incurring ~$2.3 million in exit fees as part of refinancing for these facilities [S5].
Equity decreased from approximately $138 million in FY23 to $87 million by FY25 correlating with accumulated net losses outpacing capital raises or earnings retention [F1]. There were no dividends or share repurchase programs disclosed; instead, capital allocation prioritizes reinforcing growth initiatives amidst cash flow deficits.
Litigation Landscape
Treace is actively engaged in patent infringement proceedings against major competitors leveraging similar foot and ankle surgical technologies [S4][S7]. The protective enforcement of its patent portfolio constitutes a key competitive differentiator but also exposes the company to considerable legal costs and uncertain outcomes that may affect future market positioning.
Successful litigation results could reinforce market exclusivity driving incremental sales growth; conversely, adverse rulings might erode intellectual property protection leading to intensified competition.
Future Growth Prospects and Risks
Growth potential resides primarily in expanding adoption among orthopedic surgeons for Treace’s signature devices addressing bunion correction—an area presently underserved by alternative technologies with fewer complication rates or improved patient recovery profiles [N1][S6]. The company’s ability to unlock additional tranches of its term loan hinges on meeting defined revenue benchmarks by future reporting periods incentivizing sustained top-line momentum [S5].
Nonetheless, persistent net losses raise concerns about scalability of profitability absent significant margin improvement or cost containment.
Patent litigation adds uncertainty as defensive actions absorb resources without guaranteed success.
Additionally:
- Reliance on debt financing introduces refinancing risk especially if earnings trajectory falters.
- Continued negative free cash flow—approximately -$29 million in FY25 after capex adjustments—may pressure working capital or necessitate further capital raises absent operational breakeven progress [F1].
What To Watch
- Quarterly revenue trends relative to milestones for full tranche draws under existing credit facilities.
- Updates on patent litigation status that may influence competitive dynamics.
- Margin progression coupled with any indication from management regarding path to profitability.
- Cash burn rates versus available liquidity given high ongoing capex requirements.
Summary Table of Key Annual Financial Metrics ([F1])
| Metric | FY2022 | FY2023 | FY2024 | FY2025 |
|---|---|---|---|---|
| Revenue ($M) | 141.8 | 187.1 | 209.4 | 212.7 |
| Operating Income ($M) | -34.8 | -51.4 | -55.7 | -54.2 |
| Net Income ($M) | -42.8 | -49.5 | -55.7 | -59.0 |
| Operating Cash Flow ($M) | -30.6 | -34.6 | -37.2 | -16 |
| Capex ($M) | 14.8 | 11.5 | 11.6 | 13.5 |
| Current Ratio | >4 | |||
| Equity ($M) | 60.5 | 138 | 113 | 87 |
Conclusion
Treace Medical Concepts has engineered steady revenue growth through niche orthopedic device innovation fortified by intellectual property defenses that sustain its competitive moat within foot and ankle surgery markets.
However, the persistence of negative earnings underscores challenges balancing aggressive investment against path-to-profitability timelines—a common tension among growth-stage medtech firms innovating within regulatory-intensive environments.
Robust liquidity enabled by structured loan facilities provides operational runway but comes with strict covenant obligations tethered to performance metrics.
Execution risks tied to legal disputes over IP rights along with achieving scale economics will remain focal points for stakeholders monitoring future value creation potential.
This analysis is based solely on information sourced from company filings and publicly available disclosures dated up to February 28, 2026 ([F1], [S#], [N#]). It is intended for informational purposes without providing investment advice or recommendations.
Disclaimer: This is research-only, informational analysis and not investment advice. It may include AI-generated interpretation and general industry context. Always verify important details using primary sources.
Comments