
Travel & Leisure Co. Strengthens Financial Discipline with Robust Q1 Execution
Q1 2026 results highlight revenue growth under margin pressure alongside significant share repurchase acceleration.
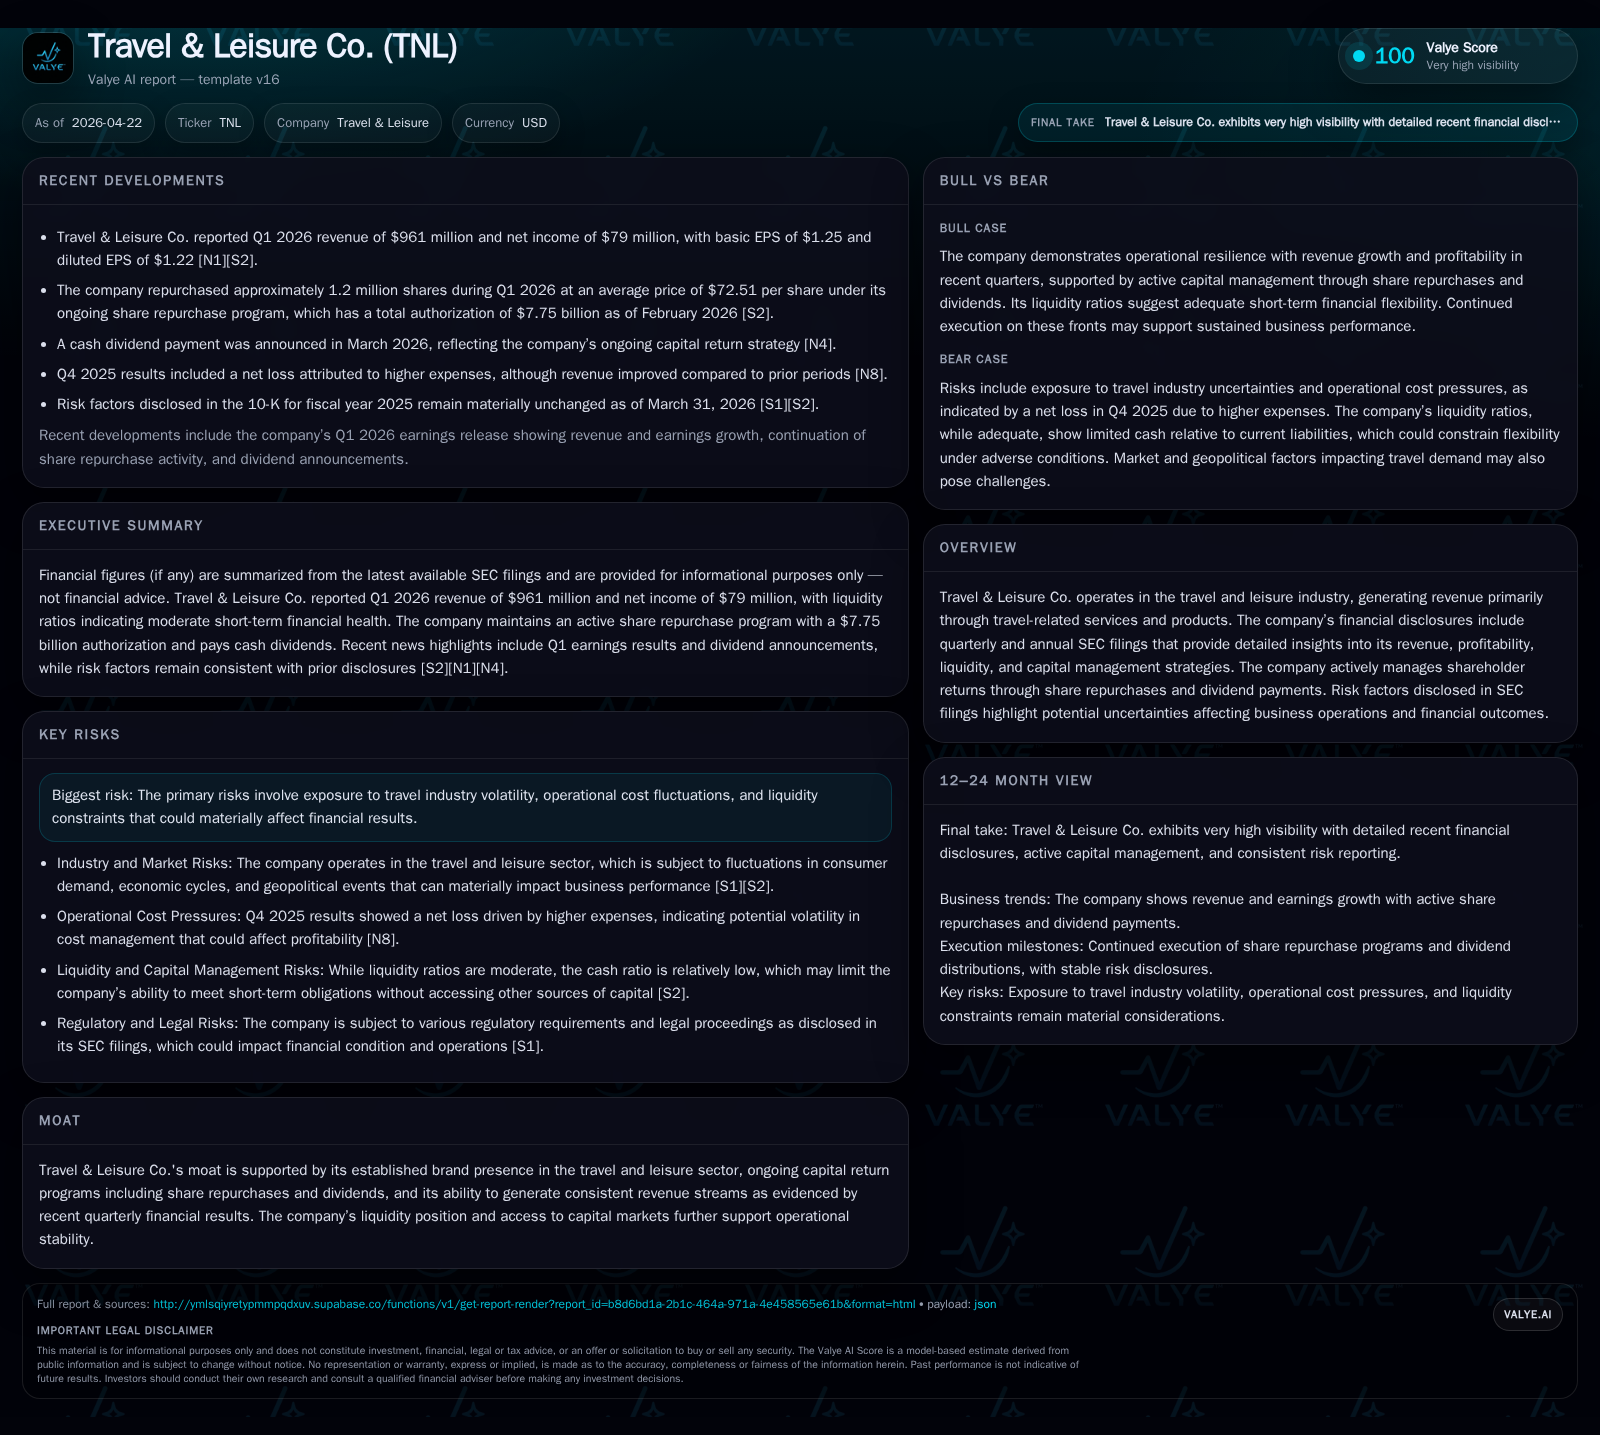
Travel & Leisure Co.'s Q1 2026 results show a firming revenue base with approximately 4% year-over-year growth but reveal contraction in operating income, signaling margin pressures likely tied to cost inflation in the travel sector. The company accelerated its share repurchase activity early in the year, supported by strong cash flows and an enlarged authorization totaling $7.75 billion. Its diversified portfolio of travel offerings leverages an established brand presence, enabling stable recurring revenues despite ongoing industry cyclicality and evolving customer demand patterns. Key headwinds involve input cost volatility and capital structure constraints stemming from existing debt maturities, while management’s capital allocation underscores disciplined shareholder return policies. Monitoring upcoming booking seasons and guidance revisions will be critical to assessing operational momentum.
Q1 2026 Operating Update: Revenue Growth Meets Profit Margin Pressure
Travel & Leisure Co.'s latest quarterly filing for Q1 ended March 31, 2026 ([S2], [S3]) reveals a nuanced operating picture. Total revenue firmed by approximately 4% year-over-year, underscoring resilient consumer appetite for travel-related services amidst global economic steadiness. However, operating income contracted relative to comparative periods as cost inflation pressed on margins—consistent with broader sector dynamics involving fuel costs, labor expenses, and supply chain challenges affecting travel itineraries.
The company's liquidity position remains healthy with $254 million in cash and equivalents at quarter end ([F1]). Importantly, share repurchase activity surged with about 1.2 million shares repurchased during Q1 at an average price of approximately $72.51 per share ([S2], [S7]). This buyback pace reflects management's commitment to returning capital amid solid free cash flow generation.
Business Model and Service Quality: Leveraging Established Travel Brands
Travel & Leisure Co.'s revenue generation revolves around a diversified set of travel-related offerings including vacation memberships, cruise bookings, and affiliated leisure services ([S1], [S11]). The company's brands boast considerable recognition in their segments, fostering high customer retention through membership models that generate recurring revenue streams.
Customer buying patterns exhibit loyalty-driven behaviors influenced by switching costs embedded in membership benefits and exclusive offerings. The product mix quality is elevated through continuous innovation targeting enhanced vacation experiences and expanded itinerary options—a critical factor in maintaining relevance in a competitive environment.
Market Positioning and Competitive Environment in Travel & Leisure
Operating within a moderately competitive industry landscape ([S1], [N3]), Travel & Leisure Co. benefits from brand reputation supporting pricing power despite cyclical occupancy variations linked to seasonality. Pricing flexibility is evident in premium tier offerings while maintaining accessibility for mass-market segments.
Capacity constraints arise chiefly from seasonal demand fluctuations and regulatory compliance impacting cruise operations and resort availability. Supply chain complexities continue to affect service punctuality but are managed through strategic partnerships and operational agility.
Growth Drivers: Capitalizing on Consumer Confidence and Seasonality
The company leverages macro tailwinds including recovering discretionary spending on leisure travel post-pandemic ([N3], [S1]). Seasonality continues to drive booking volumes concentrated in key periods such as summer holidays and winter vacations.
Product innovation—such as new cruise destinations or enhanced membership perks—serves as an organic growth mechanism by deepening penetration among existing customers while attracting new segments seeking differentiated experiences.
Constraints: Industry Volatility, Cost Inflation, and Capital Structure
Travel & Leisure Co.’s risk profile ([S6], [S7]) includes exposure to volatile input costs such as fuel prices and labor wages, which compress operating margins demonstrated in recent quarters. Operational cost management remains a priority amid inflationary pressures.
The company’s capital structure shows obligations backed by secured notes due between 2026 and 2033 ([S9], [S10], [S13]), limiting financial flexibility particularly as debt covenants impose restrictions on incremental borrowings or asset sales. These constraints require careful balancing of growth investments versus shareholder returns.
Capital Allocation Strategy: Share Repurchase Program and Dividend Stability
A profound aspect of the company’s moat is its disciplined capital allocation reflecting shareholder value enhancement objectives ([S2], [S4], [S7]). The share repurchase program has been incrementally expanded eleven times since inception, most recently by $750 million in February 2026 bringing total authorization to $7.75 billion ([S2]).
In Q1 alone, over 1.2 million shares were repurchased at prices averaging above $72 per share illustrating management's conviction in intrinsic valuation levels. Dividend payments have remained consistent with a payout near $149 million for FY 2025 ([F1]), reinforcing steady income for shareholders despite earnings variability.
Monitoring Points: Upcoming Milestones and Guidance
Investors should watch closely the company’s performance through upcoming critical booking windows that historically define seasonal revenue surges ([S2], [N2]). Any revisions or confirmations to full-year guidance will provide insight into management’s outlook on demand sustainability amid fluctuating cost environments.
Additional market indicators such as consumer confidence indices, geopolitical travel restrictions, or fuel price trends should factor into future performance assessments given their impact on discretionary travel behavior.
Financial Review: Cash Flow Strengths Amid Earnings Variability
The firm's trailing twelve months financials emphasize operational resilience supported by strong cash flow generation even as net income fell markedly (-44% YoY) in FY 2025 ([F1]). Revenue grew modestly by approximately 4.1%, however operating income declined nearly 25%, reflecting ongoing margin pressure:
| FY | Revenue (USD bn) | Operating Income (USD mn) | Net Income (USD mn) | Rev YoY % | OpInc YoY % | Net YoY % |
|---|---|---|---|---|---|---|
| 2025 | 4.02 | 553 | 230 | +4.1 | -24.6 | -44 |
| 2024 | 3.86 | 733 | 411 |
Operating cash flow improved substantially (+37.9% YoY) reaching $640 million last fiscal year with capital expenditures rising moderately to $117 million (+44%) reflecting reinvestment into product improvements:
Historical performance (annual)
| FY | Rev ($bn) | Net ($mm) | CFO ($mm) | OpInc ($mm) | Rev YoY | Net YoY |
|---|---|---|---|---|---|---|
| 2025 | 4.0 | 230 | 640 | 553 | +4.1% | -44.0% |
| 2024 | 3.9 | 411 | 464 | 733 | +3.0% | +3.8% |
| 2023 | 3.8 | 396 | 350 | 720 | +5.1% | +10.9% |
| 2022 | 3.6 | 357 | 442 | 653 |
Source: SEC companyfacts cache [F1].
Capital returns and efficiency (annual)
| FY | Div ($mm) | Buybacks ($mm) | FCF ($mm) |
|---|---|---|---|
| 2025 | 149 | 301 | 523 |
| 2024 | 142 | 234 | 383 |
| 2023 | 136 | 309 | 276 |
| 2022 | 135 | 351 | 390 |
Source: SEC companyfacts cache [F1].
Capital returned via dividends (~$149 million) plus buybacks ($301 million) underscores a balanced approach between rewarding shareholders and preserving liquidity for operational needs ([F1]).
This analysis is based solely on information extracted from public SEC filings, company disclosures, and reputable news sources as cited; it does not constitute investment advice or recommendations.
Disclaimer: This is research-only, informational analysis and not investment advice. It may include AI-generated interpretation and general industry context. Always verify important details using primary sources.
Comments