
Oncology Institute’s Growth Hinges on Value-Based Contracts Amid Persistent Losses and Liquidity Strain
TOI scales patient reach through value-based care while wrestling with operational losses and financial challenges.
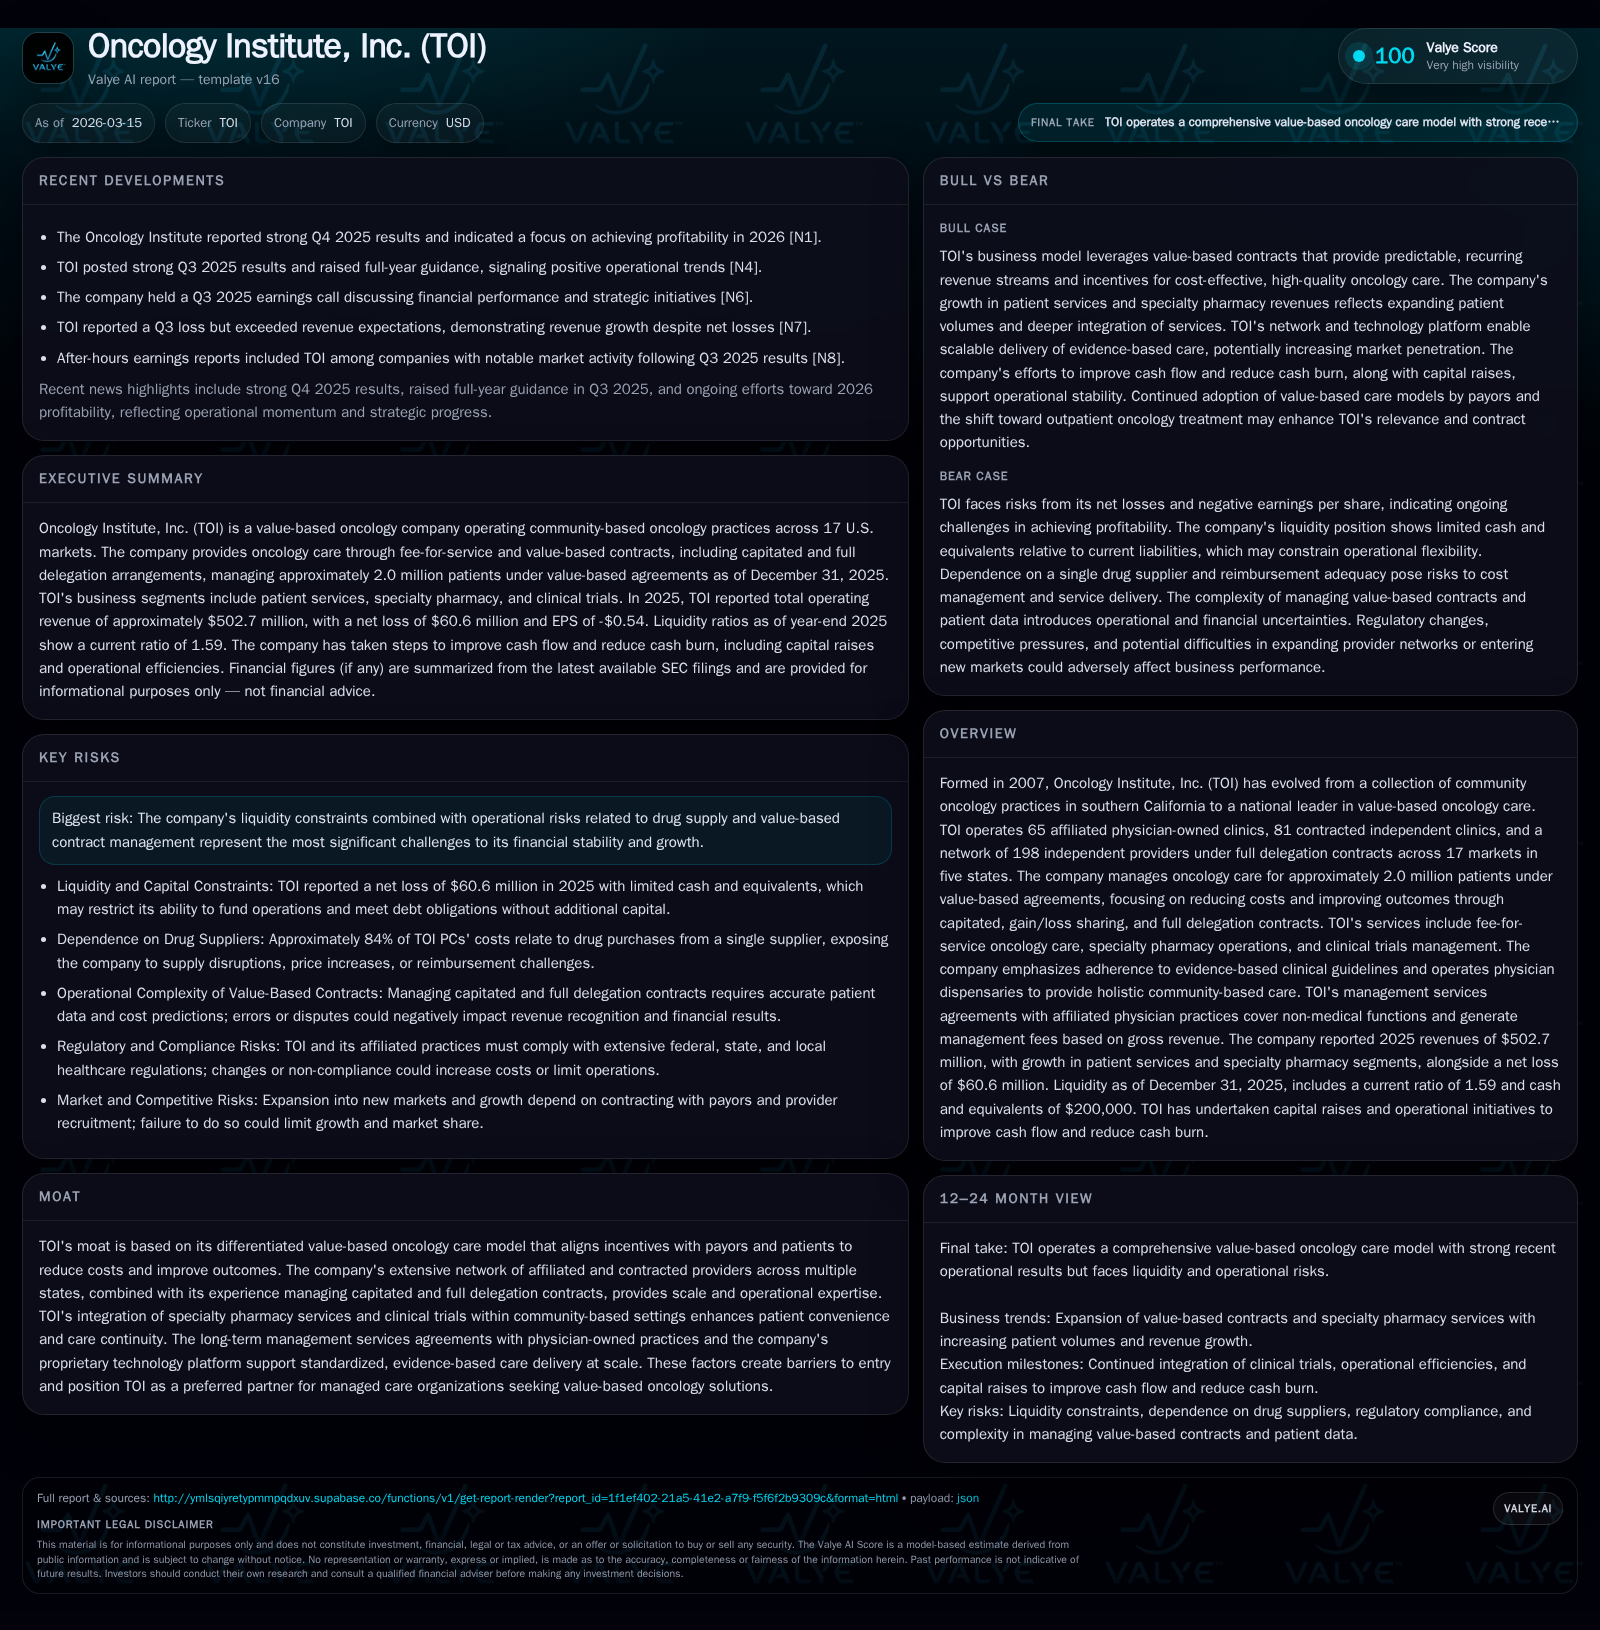
The Oncology Institute, Inc. (TOI) has expanded rapidly since its inception in 2007, evolving from a regional player in community oncology to a national leader operating over 60 physician-owned clinics and managing about 2 million patients under value-based contracts. Despite top-line growth powered by population health management contracts across multiple states, the company continues to report significant operating and net losses, reflecting high costs of scaling and risk management complexities inherent in oncology care. TOI’s future growth relies on deepening value-based relationships with payors and expanding clinic capacity, but liquidity constraints and reimbursement risks pose ongoing challenges. Monitoring milestone profitability targets for 2026 and operational improvements will be critical to assessing TOI’s path toward sustainable cash flow generation.
Company Background and Historical Performance
Founded in 2007 originally as a consortium of community oncology practices in southern California, The Oncology Institute, Inc. (TOI) has progressively evolved into a substantial multi-state operator focused on value-based oncology care delivery [S1]. Today, it manages an extensive network including 65 affiliated physician-owned clinics staffed by approximately 116 oncologists and advanced practice professionals, alongside over 200 contracted providers primarily under delegation agreements spread across five states [S1]. This scale is significant against the backdrop of outpatient oncology shifting toward chronic disease management models emphasizing cost containment and outcome improvements.
TOI's business model merges traditional fee-for-service care with innovative value-based contracts that incorporate capitation, gain/loss sharing, and full delegation arrangements at the population level. These frameworks shift clinical risk primarily onto physician entities affiliated with TOI (TOI PCs), aligning incentives to reduce unnecessary interventions while maintaining evidence-based treatments.
Financially, TOI has demonstrated steady progress growing its patient base covered under capitated arrangements to approximately two million individuals as of end-2025 [S1,F1]. However, this expansion has come with sustained operating losses; reported operating income improved from a deficit of $60.1 million in FY2024 to a loss of $36.1 million in FY2025 (a 40% improvement year-over-year), whereas net losses slightly narrowed from $64.7 million to $60.6 million during the same period [F1]. Operating cash flows indicate volatility — returning negative at -$24.6 million in FY2025 after generating $4.0 million positive cash flow in FY2024 — reflective of the capital intensity needed to support clinic expansion, technology investments, and contract infrastructure [F1]. Capital expenditures have declined modestly but remain material at about $3.2 million [F1].
Historical performance (annual)
| FY | Net ($mm) | CFO ($mm) | OpInc ($mm) | Capex ($mm) | Net YoY |
|---|---|---|---|---|---|
| 2025 | -61 | -25 | -36 | 3 | +6.3% |
| 2024 | -65 | 4 | -60 | 4 | +22.2% |
| 2023 | -83 | -36 | -77 | 5 | -54750.0% |
| 2022 | 0 | -62 | -82 | 6 |
Source: SEC companyfacts cache [F1].
Capital returns and efficiency (annual)
| FY | Buybacks ($mm) | FCF ($mm) | ROE% |
|---|---|---|---|
| 2025 | -28 | 385.5 | |
| 2024 | 0 | 0 | -1801.7 |
| 2023 | 1 | -41 | -145.7 |
| 2022 | 9 | -67 | 0.1 |
Source: SEC companyfacts cache [F1].
Table: Summary of key annual financial metrics for FY2022–FY2025 [F1]
The balance sheet shows the company carried a negative equity position of about $15.7 million at year-end 2025 versus positive equity of $3.6 million a year prior due to accumulated deficits surpassing net assets [F1]. Current assets stand at approximately $112.7 million against current liabilities near $70.9 million yielding a current ratio around 1.6x — indicating near-term liquidity is manageable albeit tight given operational cash burn [F1]. Notably cash & equivalents stood at $33.5 million at FY-end according to disclosures although earlier snapshot references smaller balances indicating fluctuations related to financing activities [S5],[F1].
Business Model and Growth Drivers
TOI’s core strategic advantage lies in orchestrating value-based oncology care that spans comprehensive outpatient services including medical oncology infusions; in-house specialty pharmacy dispensing; radiation therapy access; clinical trials enrollment; palliative care; education; support services; and round-the-clock patient communications—all within community settings that traditionally lacked such integrated offerings [S1]. Unlike typical hospital or academic center-centric models which can incur higher overheads with fragmented care delivery patterns, this approach centralizes accountability under capitated contractual arrangements.
By firmly embedding physician-owned professional corporations within these contracts—entities bearing downside risk on treatment costs—TOI fosters alignment not only with payor interests around cost control but also emphasizes evidence-based personalized care plans aimed at minimizing overtreatment or non-beneficial interventions [S1],[S21]. With more than half its revenue derived from value-based contracts negotiated with prominent insurers such as Anthem or Optum Care—and a diversified payor base ensuring no one customer accounts for excessive revenue concentration—the network robustness supports incremental scaling as new market expansions improve risk pool size [S21].
Growth prospects emanate principally from:
- Expanding Clinic Infrastructure: Increasing provider headcount linked directly to network adequacy obligations within capitated markets allows deeper market penetration.
- Broadening Value-Based Contract Penetration: Engaging additional managed care plans or risk-bearing intermediaries incentivized to delegate outpatient oncology risk.
- Diversifying Services: Enhancing ancillary offerings like specialty pharmacy yield better margins while integrating clinical trial management introduces pharmaceutical industry partnerships.
- Leveraging Proprietary Technology Platform: Standardizing clinical guidelines across disparate practices improves consistency in quality measures facilitating bonus incentives embedded within payor contracts.
However growth faces natural impediments:
- Physician Recruitment Challenges: Regulatory restrictions on enforceability of non-compete clauses vary widely limiting ability to retain specialist talent fully [S24].
- Rising Oncology Drug Costs: Given significant portion of costs relate to pharmaceuticals reimbursed through complex PBM arrangements which may narrow margins or trigger payment disputes [S21],[S18].
- Contractual Risk Exposure: Under capitated agreements affiliated PCs assume financial risks if costs exceed allocated budgets potentially reducing profitability if forecasting is inaccurate [S18].
- Geographic Concentration: Majority presence in five states elevates exposure to variations in state-level regulatory frameworks governing insurance licensing for downstream risk entities [S13,S21].
- Regulatory Compliance: Complex healthcare regulations spanning data privacy (HIPAA/CCPA), specialty pharmacy licensing requirements and anti-kickback statutes require sustained investment mitigating legal risks .
Financial Outlook and Milestones
While explicit public guidance is limited beyond indications by management aiming for profitability during calendar year 2026 following operational enhancements reported post-Q4 results [N1], investors will closely watch several key indicators:
- Improvement Trajectory in Operating Margins: Reduction of losses below current mid-teens percentage levels of revenue.
- Positive Free Cash Flow Generation: Transitioning from negative operating cash flows coupled with modulated capital spending towards consistent free cash flow.
- Expansion of Value-Based Population: Sustained increase beyond current ~2 million covered lives validating contracting strategy.
- Stabilization or Improvement in Equity Position: Reaching non-negative net equity amid profitability progress reducing financing dependency.
Due attention is warranted regarding potential reimbursement rate adjustments post healthcare reform initiatives impacting Medicare payments or shifts induced by payor consolidations which could alter contract economics adversely [S18,S21]. Transparency around updates to contract compositions—such as increased use of alternative payment models—and clarity on drug supply chain dynamics will similarly influence trajectory.
Capital Allocation & Returns Profile
Consistently negative net incomes mean TOI has not generated returns on equity historically; calculated ROE based on last reported figures yields approx -385%, reflective chiefly of accumulated deficits overshadowing modest equity base as of December 31st 2025 [F1]. The ongoing losses underline absence of distributable earnings for dividends—none have been declared historically nor planned given reinvestment priorities and liquidity focus.
Capital allocation appears focused predominantly on supporting growth initiatives: capacity expansion reflected by steady capex spending near $3M annually; modest repurchase activity ceased after FY2023 showing zero buybacks most recently [F1]. The Company's debt restructuring completed recently relieved some financial covenant burdens but elevated leverage demands substantial interest servicing costs that constrain free cash availability [S5,S8,S15]. The IPO-era private placement supplemented working capital but fresh capital raising may be required absent imminent positive cash flow conversion.
Management's strategy involves balancing liquidity preservation with strategic investments needed to scale network adequacy within contracted markets—a classic challenge faced by rapidly expanding outsourced healthcare service providers reliant on complex reimbursement models.
Risk Considerations
Key risks revolve around:
- Liquidity Constraints: Negative operating cash flows combined with growing contractual obligations necessitate continuous access to funding sources; failure could impair operations or limit growth options [S5,S8,S15].
- Contractual Complexity & Pricing Risk: Estimating allowable revenue under capitated arrangements is challenging given fluctuating member eligibility data from payors impacting revenue recognition accuracy [S18,S19].
- Regulatory Risk: Wide-ranging legal compliance mandates create ongoing cost burdens; non-compliance could result in fines or loss of licenses particularly relating to specialty pharmacy operations or managed care licensure requirements across jurisdictions where TOI operates .
- Talent Retention Issues: Physician turnover influenced by restrictive covenant enforceability limitations poses competitive disadvantage threats versus other providers vying for scarce oncology specialists [S24].
- Market Concentration & Competition: While payor concentration risk is moderate given largest customer accounts for ~14%, intense competition among managed care networks could pressure contract terms unfavorably over time affecting patient volumes [S21,S18].
Conclusion & Monitoring Points (Analysis)
Oncology Institute stands out as a pioneering model embedding value-based principles into community oncology amid an industry grappling with soaring drug costs and fragmented care delivery paradigms. Its demonstrated capability securing large-scale capitated contracts confers a moat through aligned economic incentives across physicians and payors coupled with comprehensive service integration including specialty pharmacy and clinical trials—a combination not widely replicated among peer groups.
Yet this ambition runs counterbalanced by persistent losses fueling mounting accumulated deficits whilst cash flow volatility undermines near-term financial stability critical for sustaining network quality and investing in further expansion.
Key points worth monitoring include quarterly progression toward break-even profitability milestones flagged for calendar year 2026; developments pertaining to contract renewal or expansion activity evidencing acceptance by existing payors; fluctuations in regulatory environment particularly around reimbursement methodologies or managed care licensure mandates; shifts in physician workforce dynamics especially concerning retention amid labor constraints; as well as capability maintaining technological platforms underpinning standardized evidence-based clinical pathways supporting scale economies.
The company’s next steeps hinges not just on volume but mastering execution detail spanning predictive analytics informing risk adjustments through efficient operational workflows coupled tightly with robust compliance frameworks that collectively underpin credibility with payors on sustaining cost containment without compromising outcomes essential for enduring success within the changing oncology care ecosystem.
This analysis is informational only and does not constitute investment advice or recommendations regarding securities issued by The Oncology Institute Inc.
Disclaimer: This is research-only, informational analysis and not investment advice. It may include AI-generated interpretation and general industry context. Always verify important details using primary sources.
Comments