
VNET Group’s Expansion in China’s Carrier-Neutral Data Center Market Constrained by Intensifying Capex and Net Losses
VNET leverages a dual-core wholesale-retail data center strategy with industry-leading interconnectivity but faces pressure from rising investments and ongoing losses despite operational improvements.
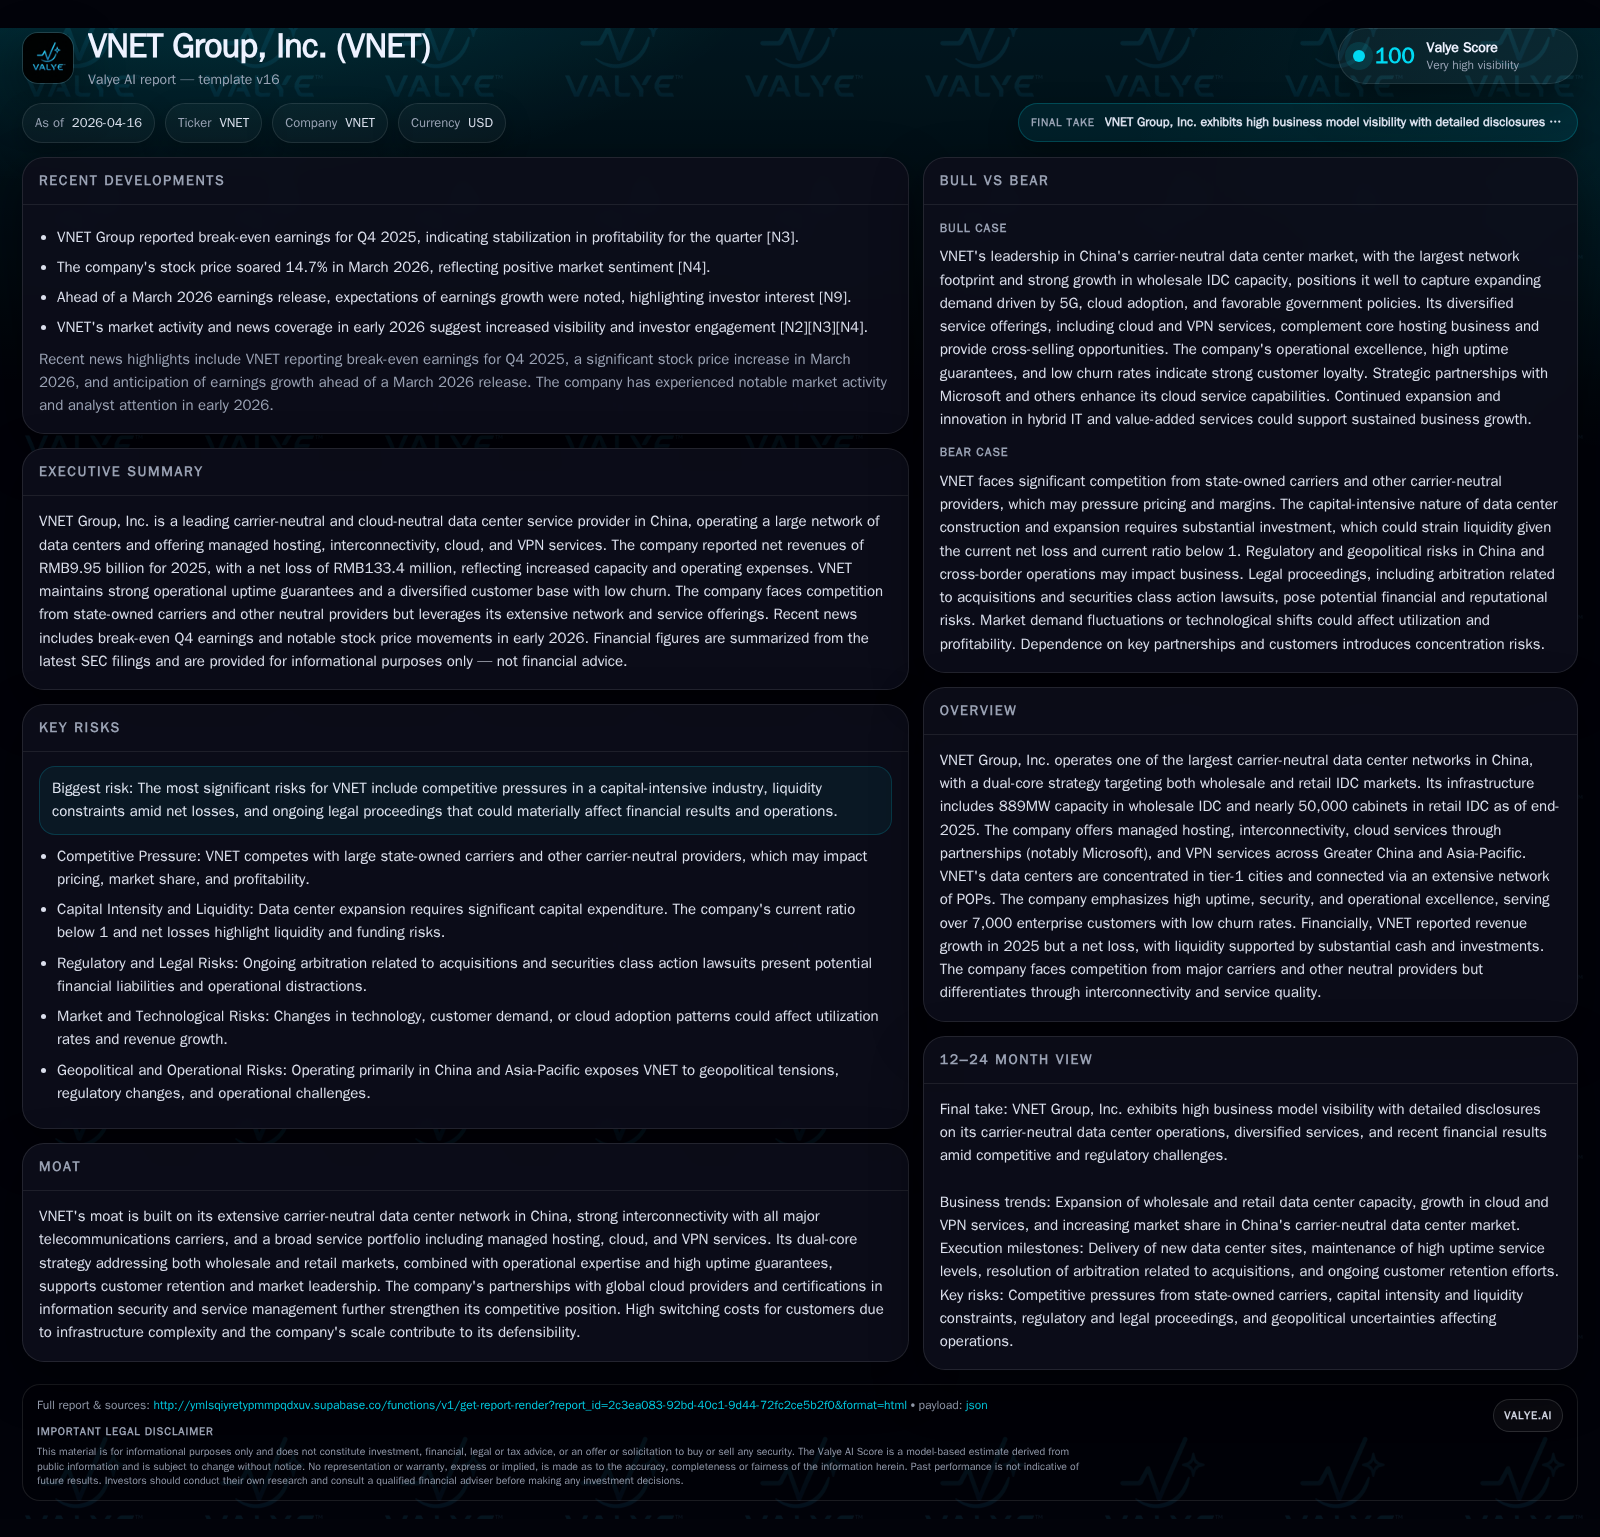
VNET Group operates one of the largest carrier-neutral data center networks in China, focusing on both wholesale and retail colocation services complemented by cloud and VPN offerings. The company has steadily grown revenues with capacity expansions reaching nearly 889MW for wholesale IDC and approximately 50,000 cabinets for retail IDC as of end-2025. Despite a return to operating income profitability in 2025, net losses persist amid substantial capital expenditures aimed at scaling infrastructure and deploying advanced technology solutions. VNET's competitive moat stems from its extensive interconnectivity, strategic partnerships (notably with Microsoft), and high service quality, yet risks remain around liquidity pressures and regulatory complexities specific to the China market.
Company Overview
VNET Group, Inc. stands as one of China’s largest carrier-neutral data center operators with a footprint anchored heavily in tier-1 metropolitan areas including Beijing, Shanghai, Shenzhen, Guangzhou, Hangzhou, Xi’an, and Hong Kong. The firm employs a "dual-core" business model targeting both wholesale customers—mainly internet giants and large cloud providers—with custom-built data centers totaling an aggregate power capacity of about 889MW as of December 31, 2025; and retail clients who lease server cabinet space aggregating close to 50,000 cabinets across its network [S4][S6][S11].
This dual approach allows VNET to offer scalable colocation services ranging from single cabinets to megawatt deployments alongside bespoke infrastructure designed per customer specifications.
Complementing its hosting business are interconnectivity solutions via an extensive network of 224 Points-of-Presence (POPs) enabling robust cross-network traffic flows throughout Greater China and Asia-Pacific regions. Additionally, VNET offers cloud service integration through partnerships—most notably Microsoft Azure—and value-added VPN services including SD-WAN targeting various enterprise verticals [S16][S25][S6].
Historical Performance and Growth Drivers
Revenue generation is exclusively tied to hosting and related services encompassing the wholesale IDC business, retail IDC business, along with non-IDC activities involving cloud solutions and enterprise VPN services.
The company has exhibited consistent top-line growth over recent years according to reported figures:
Historical performance (annual)
| FY | Net ($mm) | CFO ($mm) | OpInc ($mm) | Capex ($mm) | Net YoY |
|---|---|---|---|---|---|
| 2025 | -36 | 274 | 112 | 1095 | -243.5% |
| 2024 | 25 | 275 | 92 | 675 | +106.7% |
| 2023 | -372 | 291 | -278 | 418 | -231.0% |
| 2022 | -113 | 354 | 18 | 434 |
Source: SEC companyfacts cache [F1].
Capital returns and efficiency (annual)
| FY | FCF ($mm) | ROE% |
|---|---|---|
| 2025 | -821 | -4.0 |
| 2024 | -400 | 2.9 |
| 2023 | -127 | -44.0 |
| 2022 | -81 | -11.7 |
Source: SEC companyfacts cache [F1].
The growth trajectory reflects expanding utilization primarily within the wholesale segment which commands long-term contracts typically spanning eight to ten years compared to shorter one-to-three year agreements in retail colocation that often auto-renew.
Utilization rates as of end-2025 stood at approximately:
- Wholesale IDC: Capacity commitment at ~95%, utilized at ~70%
- Retail IDC: Utilization near ~64%
These rates highlight ongoing capacity deployment efforts balanced against market demand fluctuations [S20].
Operating income sharply rebounded from substantial negative results in prior years to a positive $111 million in FY2025—representing about a +21.7% year-over-year improvement—indicating enhanced operational efficiency or scale benefits despite lingering net losses driven by elevated depreciation/amortization or financing costs [F1].
Future Growth Prospects
The overarching market backdrop appears favorable with Frost & Sullivan forecasting China's carrier-neutral data center market growth at an estimated CAGR of around 18.5% between 2025-2030 fueled by factors such as increasing IT outsourcing adoption among enterprises, rollout of advanced communications technology such as 5G, rising demand from cloud providers and internet companies coupled with government support policies encouraging infrastructure buildouts [S12].
Specifically for VNET:
- Expansion will focus on enlarging self-built data center capacity primarily across the Greater Beijing Area, Yangtze River Delta, Greater Bay Area supporting wholesale customer demand.
- The company aims to improve margins by increasing proportionate capacity in owned versus leased partner facilities which generally command lower gross margin due to carrier rent markups.
- Growth also leverages ecosystem partnerships for hybrid cloud offerings integrating public/private clouds alongside robust VPN security capabilities targeted at vertical industries.
- Enhanced research & development focused on energy-saving cooling technologies and IT operational efficiency platforms promises operational cost advantages alongside environmental sustainability goals [S24][S14].
The stable low churn rate declining over recent years (from average monthly rates of 0.4% in FY2023 down to an impressive low of around 0.1% by FY2025) underlines strong customer loyalty helping secure recurring revenue foundations [S9][S21].
Risks and Headwinds
Despite scale advantages and solid brand positioning within China’s carrier-neutral space, several risks persist:
- Liquidity pressure is tangible as evidenced by a current ratio below unity (0.92), reflecting near-term payable obligations outpacing readily available current assets including cash (~$790M) [F1][S10].
- High capital expenditures exceeding $1B annually challenge free cash flow generation; estimated FCF remains deeply negative (-$820 million in FY2025) due primarily to aggressive infrastructure investments necessary for staying competitive and meeting customer demand [F1].
- Regulatory complexities inherent to operating offshore holding companies with PRC subsidiaries introduce tax withholding uncertainties on dividend repatriations along with potential cross-border fund flow restrictions under foreign exchange regulatory frameworks that could impair capital allocation flexibility [S1].
- Competition remains fierce against dominant state telecom carriers controlling over half the market share who integrate their own vertically aligned networks and other carrier-neutral competitors like GDS posing pricing pressure threats and requiring continuous innovation in service quality differentiation [S15].
- Legal proceedings disclosed represent an operational risk factor due to unknown potential impacts on future financial results though details remain limited publicly .
Capital Allocation & Returns Profile
VNET’s total equity stands at approximately $889 million with recent net losses producing a modestly negative approximate ROE near -4% based on last reported fiscal year metrics [F1]. This contrasts favorably with prior multi-year periods exhibiting deeper losses though still indicative of ongoing profitability challenges primarily driven by ramp-up stage heavy capex commitments.
The company's operating cash flow (~$274 million) has remained relatively flat over recent years evidencing steady core business cash generation.
Capital expenditure increased markedly year-over-year by more than +60% reaching nearly $1.1 billion USD as the company aggressively pursues expansion plans for both retail and wholesale data center capacities while investing in technology innovation (e.g., energy enhancement systems).
VNET conducted share buybacks amounting to ~$2.46 million USD during FY2025 representing de minimis capital returns signaling management preference towards reinvestment rather than distributions or aggressive shareholder payouts given current growth strategy phase [F1][S17].
What To Watch Going Forward (Analysis)
Absent explicit company guidance disclosed for upcoming periods beyond early Q4 break-even earnings reports confirmed recently [N1], key indicators include:
- Utilization trends both in retail cabinet leasing rates and wholesale megawatt commitments;
- Evolving margin profiles especially gross margin improvements driven by shifting mix towards owned facilities versus leased spaces;
- Progression in cloud-neutral platform uptake through partnerships expanding beyond Microsoft alliance;
- Cash flow trends relative to capex intensity highlighting capital efficiency improvement or sustained funding needs;
- Resolution or development regarding regulatory/tax exposures impacting offshore holding-company structures;
- Competitive positioning vis-à-vis carriers’ strategic moves or other emerging neutral players.
Continuous monitoring of these parameters will clarify whether VNET can translate its infrastructural moat into sustainable profitability amidst high growth market conditions.
This report is based solely on publicly available information including SEC filings dated April 16, 2026 ([S#]), news sources ([N#]) up to April 2026, and company facts numerical disclosures ([F1]). It does not constitute investment advice.
Disclaimer: This is research-only, informational analysis and not investment advice. It may include AI-generated interpretation and general industry context. Always verify important details using primary sources.
Comments