
Walmart's Omnichannel Growth and Margin Strategies Power U.S. Comparable Sales Expansion
Walmart reports rising U.S. comparable sales driven by strong omnichannel engagement and continued capital investment in automation and supply chain.
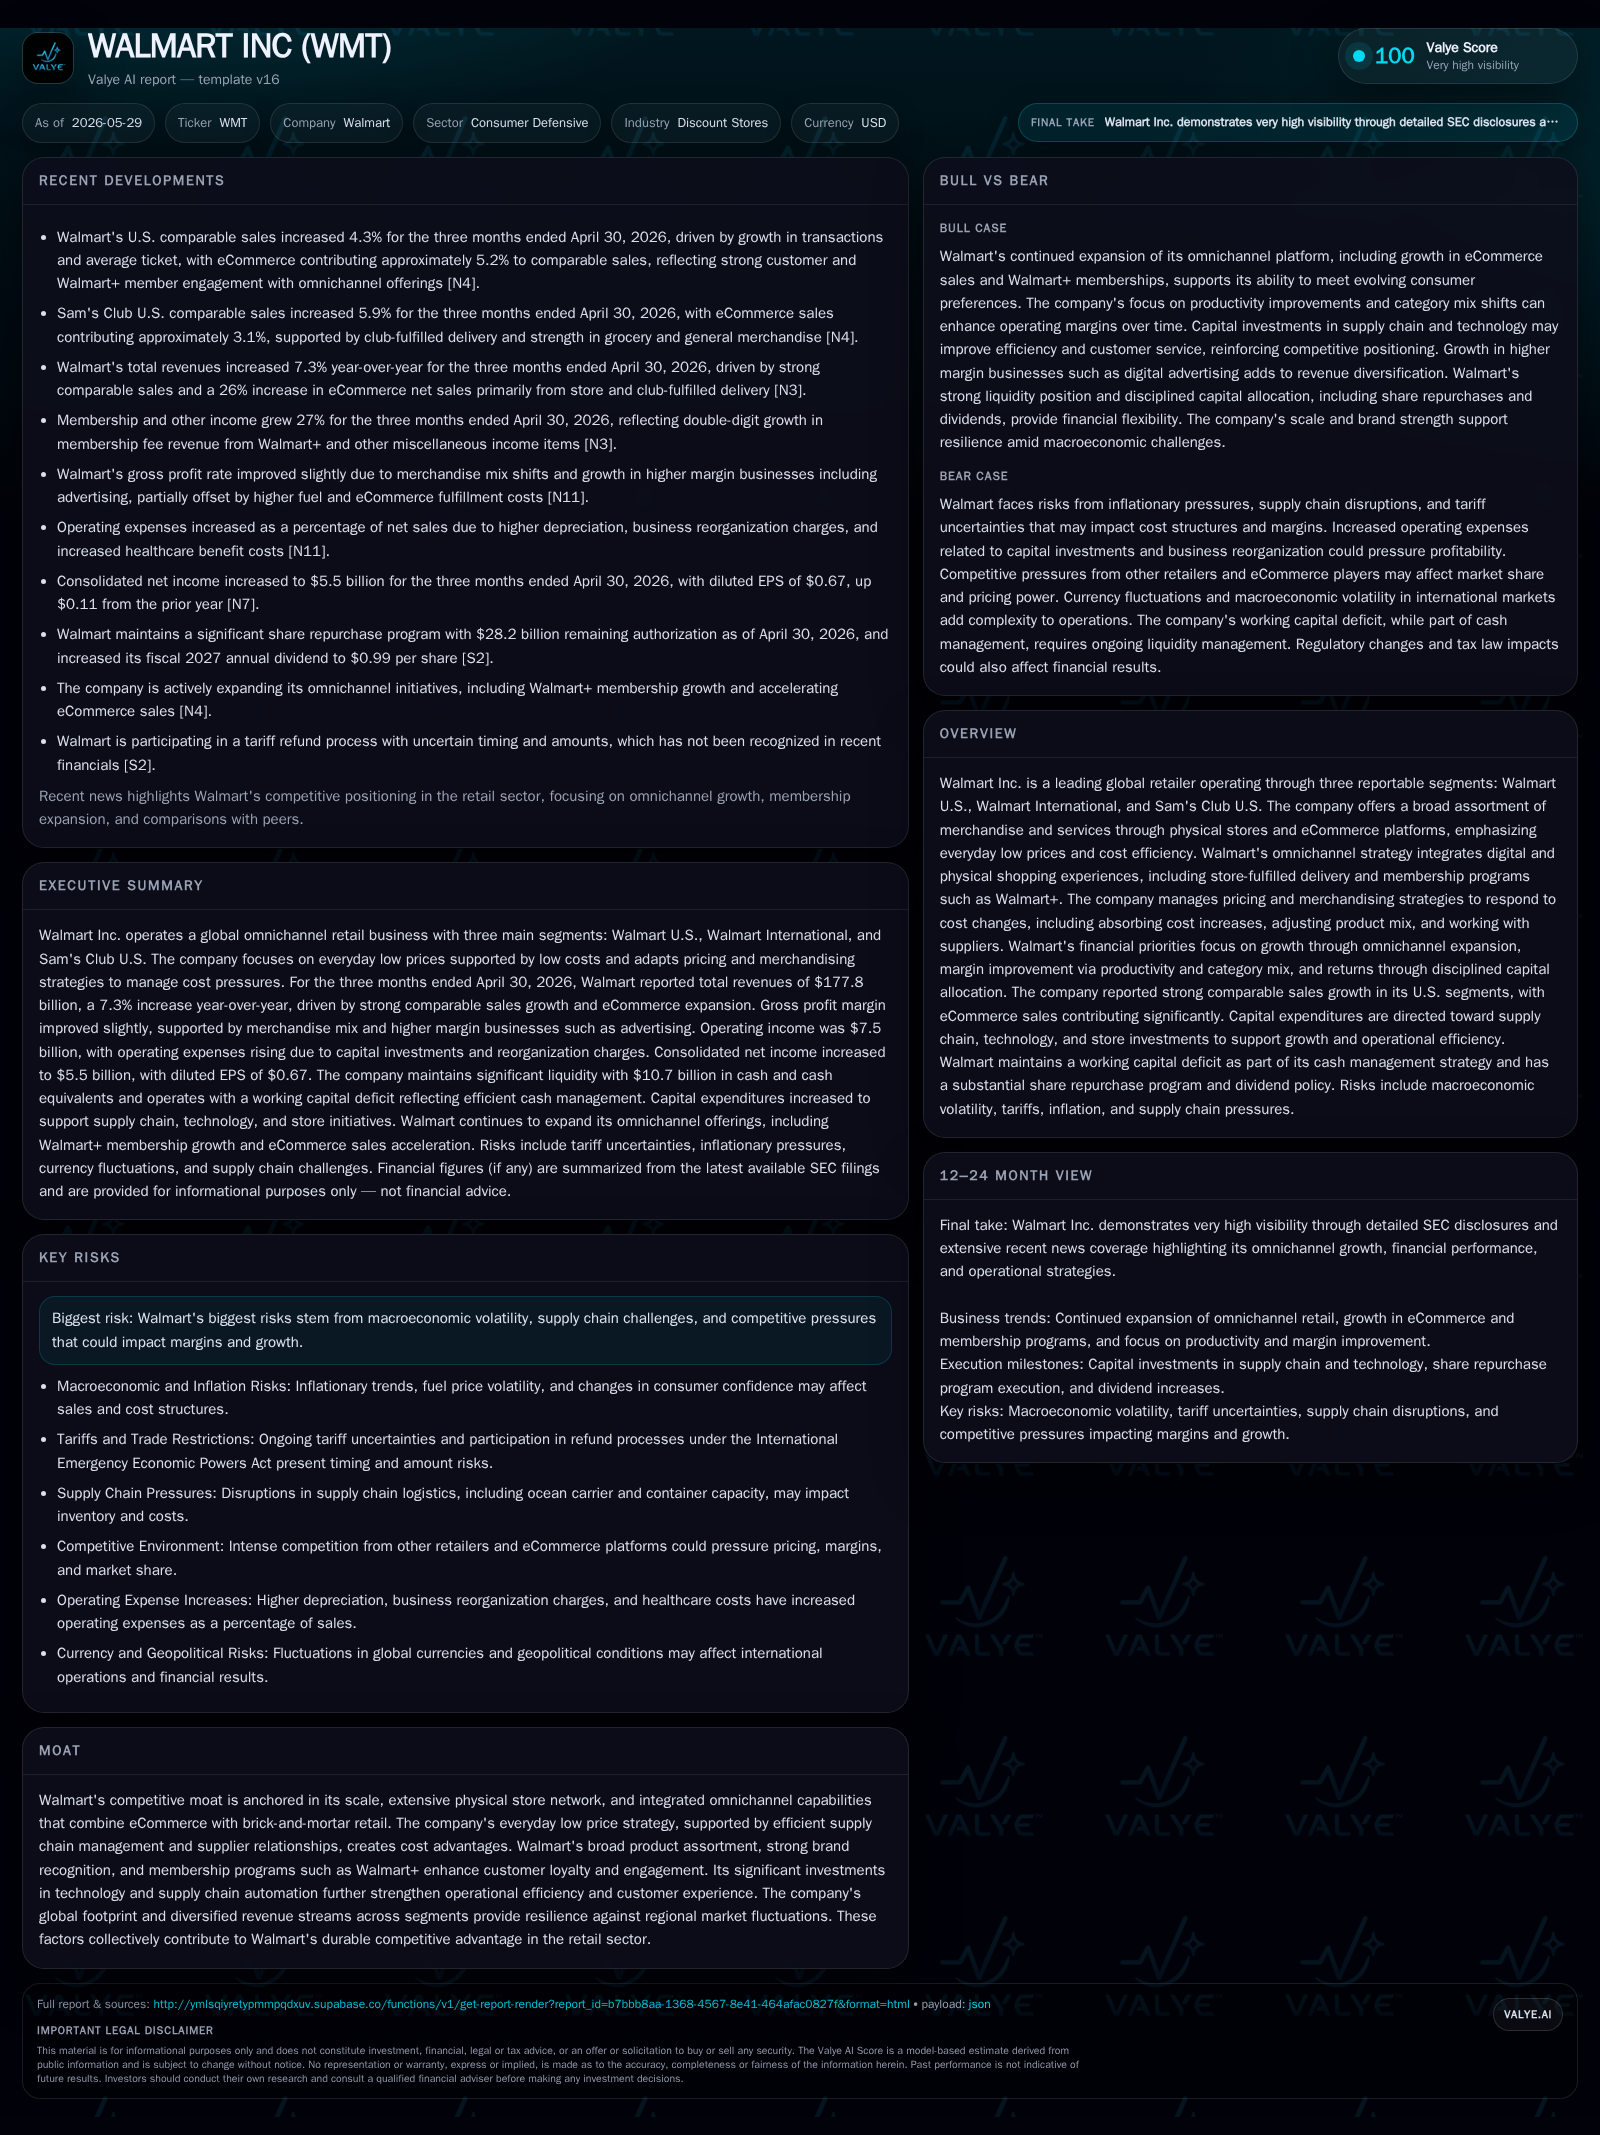
In its latest quarter ended April 30, 2026, Walmart Inc. delivered a 4.3% increase in Walmart U.S. comparable sales and a 5.9% increase at Sam’s Club U.S., fuelled by growth in transactions, average ticket, and eCommerce contributions. The company continues to prioritize omnichannel growth, investing heavily in supply chain automation, store remodels, and new locations to enhance customer experience and operational efficiency. Despite modest operating margin pressure from increased depreciation and healthcare costs, Walmart’s integrated physical and digital platform sustains its competitive moat through scale, price leadership, and membership programs like Walmart+. Key risks include inflationary volatility, supply chain disruptions, regulatory/legal uncertainties, and intensifying competition across retail channels.
Recent Operating Update
In the quarterly period ended April 30, 2026 (Q2 FY2027), Walmart Inc. reported calendar comparable sales increases of 4.3% for Walmart U.S. stores and clubs and a more pronounced 5.9% for Sam's Club U.S., both inclusive of fuel sales impact. Excluding fuel effects—material for Sam's Club due to volume and price factors—comparable sales also showed solid growth: up around 0.3% on Walmart U.S. and approximately 2.1% at Sam’s Club [S2]. The underlying drivers included growth in transaction counts and average basket size bolstered by strength in grocery and general merchandise categories.
Significantly, Walmart's digital channels are an increasingly vital contributor to this performance; eCommerce sales accounted for roughly a 5.2% positive contribution to Walmart U.S.’s comparable sales growth while Sam's Club eCommerce contributed around 3.1%. This reflects continued robust engagement with Walmart’s omnichannel offerings — notably store-fulfilled delivery options — enhancing convenience across channels for both customers and members [S2]. Complementing retail sales momentum is an 11.0% increase in membership and other income year-over-year showcasing the growing importance of subscription revenue from Walmart+ memberships alongside Sam’s Club [S2].
Capital allocation during the quarter accentuates this growth strategy with total expenditures up materially versus the prior year: $3.8 billion invested in supply chain automation, customer-facing initiatives, technology enhancements; $1.6 billion directed toward store and club remodels; plus $462 million allocated for new stores and expansion projects domestically — representing well over a $1 billion increase relative to the same period last year [S9]. Internationally capital spending also rose sharply by $340 million to over $800 million [S9]. These investments underpin improving product availability, fulfillment speed, inventory management efficiency, and overall customer experience.
While net sales grew by over 7%, operating income climbed just over 5%, resulting in a slight contraction in operating margin driven mostly by higher depreciation linked to recent capital investments, some business reorganization charges ($200 million), increased healthcare enrollment costs from medical inflation within the US workforce, as well as growing fulfillment expenses related to eCommerce growth at Sam's Club [S17]. Gross profit rate improved marginally (+6 basis points), supported by favorable merchandise mix shifts toward higher margin categories including advertising services platforms embedded within the broader ecosystem [S17].
Business Model Analysis
Walmart operates through three segments: Walmart U.S., Walmart International, and Sam's Club U.S., generating revenue from direct merchandise sales across broad categories along with membership fees (notably via Sam's Club) and ancillary services such as advertising net sales within its ecosystem [S1]. The company uniquely integrates a vast network of physical stores with an expanding digital platform to deliver an omnichannel shopping experience allowing for flexible consumer shopping preferences — online ordering with curbside pick-up or home delivery is increasingly standard.
Revenue mechanics center around high-volume retail selling with razor-thin margins achieved through everyday low pricing enabled by scale advantages in procurement/supply chain optimization plus efficient cost structures leveraging technology-driven automation [S1]. Price management involves selective absorption or pass-through of cost inflation depending upon category dynamics — e.g., private label brands are emphasized to control input pricing volatility while specific pack sizes or price points are adjusted dynamically to stimulate demand or maintain margins amidst changing cost environments [S1].
Membership fees represent recurring revenue supporting loyalty programs (Walmart+, Sam’s Club) that deepen customer stickiness and promote higher share-of-wallet capture while providing incremental services like expedited shipping or exclusive offers that differentiate from traditional discount retailers [S1]. Advertising revenues are an emerging high-margin stream helping subsidize operating costs via monetizing Walmart’s large shopper data set.
Industry Structure and Competitive Position
Walmart faces intense competition across multiple fronts: traditional discount retailers (Target), wholesale clubs (Costco), pure-play eCommerce giants (Amazon), specialty grocers, and emerging platforms leveraging technology or private labels aggressively [N11], [N4], [N1]. Its competitive moat derives primarily from unmatched scale—the largest global store network—coupled with integrated omnichannel capabilities seamlessly merging digital convenience with physical presence which few competitors can replicate at scale.
The company’s everyday low price positioning is reinforced through globally optimized sourcing strategies sourcing largely from low-cost manufacturing hubs including China and Vietnam but diversified across Mexico, India & Canada to mitigate disruption risk amid tariff uncertainties [S2]. Efficient inventory turns via automated replenishment systems minimize markdown pressures typically faced by retailers exposed to excess stock.
Strategic membership offerings such as Walmart+ leverage proprietary data assets delivering customized offers while increasing switching costs for consumers torn between multiple retailers; similarly member engagement at Sam's Club benefits from club-fulfilled delivery services enhancing speed/fulfillment quality versus peers who may rely more heavily on third-party logistics [S2],[N11].
Growth Drivers
Omnichannel Expansion: Accelerated adoption of digital shopping combined with enhanced fulfillment capabilities including same-day store deliveries elevate customer convenience driving sustained comp store growth above industry averages.
Membership Programs: Increasing wallet share per member through upselling value-added services under Walmart+ ecosystem enhances predictability of recurring revenue streams amid competitive pressures.
Capital Investment Focused on Automation: Significant capex deployment targeted at supply chain automation supports productivity gains reducing operating costs while speeding inventory turnover.
Merchandise Mix Optimization: Shifts toward higher margin product categories including private labels, health & wellness products, tech accessories plus expansive advertising platforms improve gross profitability profiles.
International Diversification: Continued expansion beyond US borders allows revenue diversification balancing regional macroeconomic variability providing geographic resilience [S9]
Risks / Watchpoints / Growth Constraints
- Macroeconomic Volatility: Inflation trends affecting consumer purchasing power could slow discretionary spending dampening traffic despite low-price strategy benefits [S2],[S27].
- Supply Chain Disruptions: Ongoing global logistics challenges including container shortages or tariff-related costs may constrain inventory availability impacting top-line momentum [S1],[S2].
- Regulatory & Legal Exposure: Complex litigation exposures remain material including opioid-related lawsuits alongside antitrust scrutiny particularly notable within international operations like Walmex Mexico subsidiary compliance proceedings [S5],[S19],[S21].
- Rising Operating Costs: Increasing associate healthcare benefit costs coupled with restructuring charges may pressure operating margins absent offsetting productivity improvements [S17].
- Competitive Intensity: Aggressive pricing or innovation advances by Amazon, Costco or Target could erode market share necessitating ongoing investment increasing cost base potentially undermining returns.
What To Watch Next
- Trajectory of comparable sales growth rates including calendar vs fuel-adjusted figures especially through key seasonal quarters.
- Expansion pace of membership base for Walmart+ and new member value initiatives rollout effectiveness.
- Progress reports on capital deployment outcomes particularly supply chain automation ROI measured via inventory turns or fulfillment cost reductions.
- Operating income margin trends reflecting balance between investments/strategic expenses vs productivity gains.
- Developments in significant legal/regulatory matters that could impact financial position or require incremental reserves.
- eCommerce penetration rates relative to total sales serving as proxy for success in integrating digital front-end with physical asset base.
Financial Profile Summary
Walmart maintains substantial scale reflected in trailing twelve months ending January 31, 2026 reporting $713 billion revenue with operating income near $29.8 billion yielding around a 4.3% operating margin supported by efficient operations despite inflationary pressures [F1], [S17]. Total debt stands near $38 billion offset by $10.7 billion cash balances as of late April 2026 maintaining liquidity flexibility; net debt approximates $27.4 billion producing manageable leverage given consistent cash flow generation from operations exceeding $41 billion annually pre-capex investments [F1], [S7], [S16]. Strong credit ratings underpin borrowing capacity enabling ongoing refinancing activity at favorable terms ensuring stability for future investments [S7], [S16], [S23].
Capital expenditures continue scaling up focused on high-return assets – nearly $6.7 billion spent in Q2 alone – emphasizing sustained commitment towards long-term competitiveness versus narrow short-term margin preservation tactics typical of retail incumbents lacking such scale/resources [S9], [S17]. Share repurchase activity moderated sequentially but remains part of capital allocation framework balancing shareholder returns alongside reinvestment needs considering opportunistic valuation environments [S15], [S24].
Disclaimer: This analysis is provided solely for informational purposes without any investment advice or research view regarding the securities discussed.
Disclaimer: This is research-only, informational analysis and not investment advice. It may include AI-generated interpretation and general industry context. Always verify important details using primary sources.

Comments