
Acadian Asset Management’s 2025 Growth Surge and Debt Refinancing Enhance Financial Flexibility
The firm’s revenue surged significantly through 2023, while recent credit facility agreements and senior note redemption reshaped its capital structure to extend debt maturities.
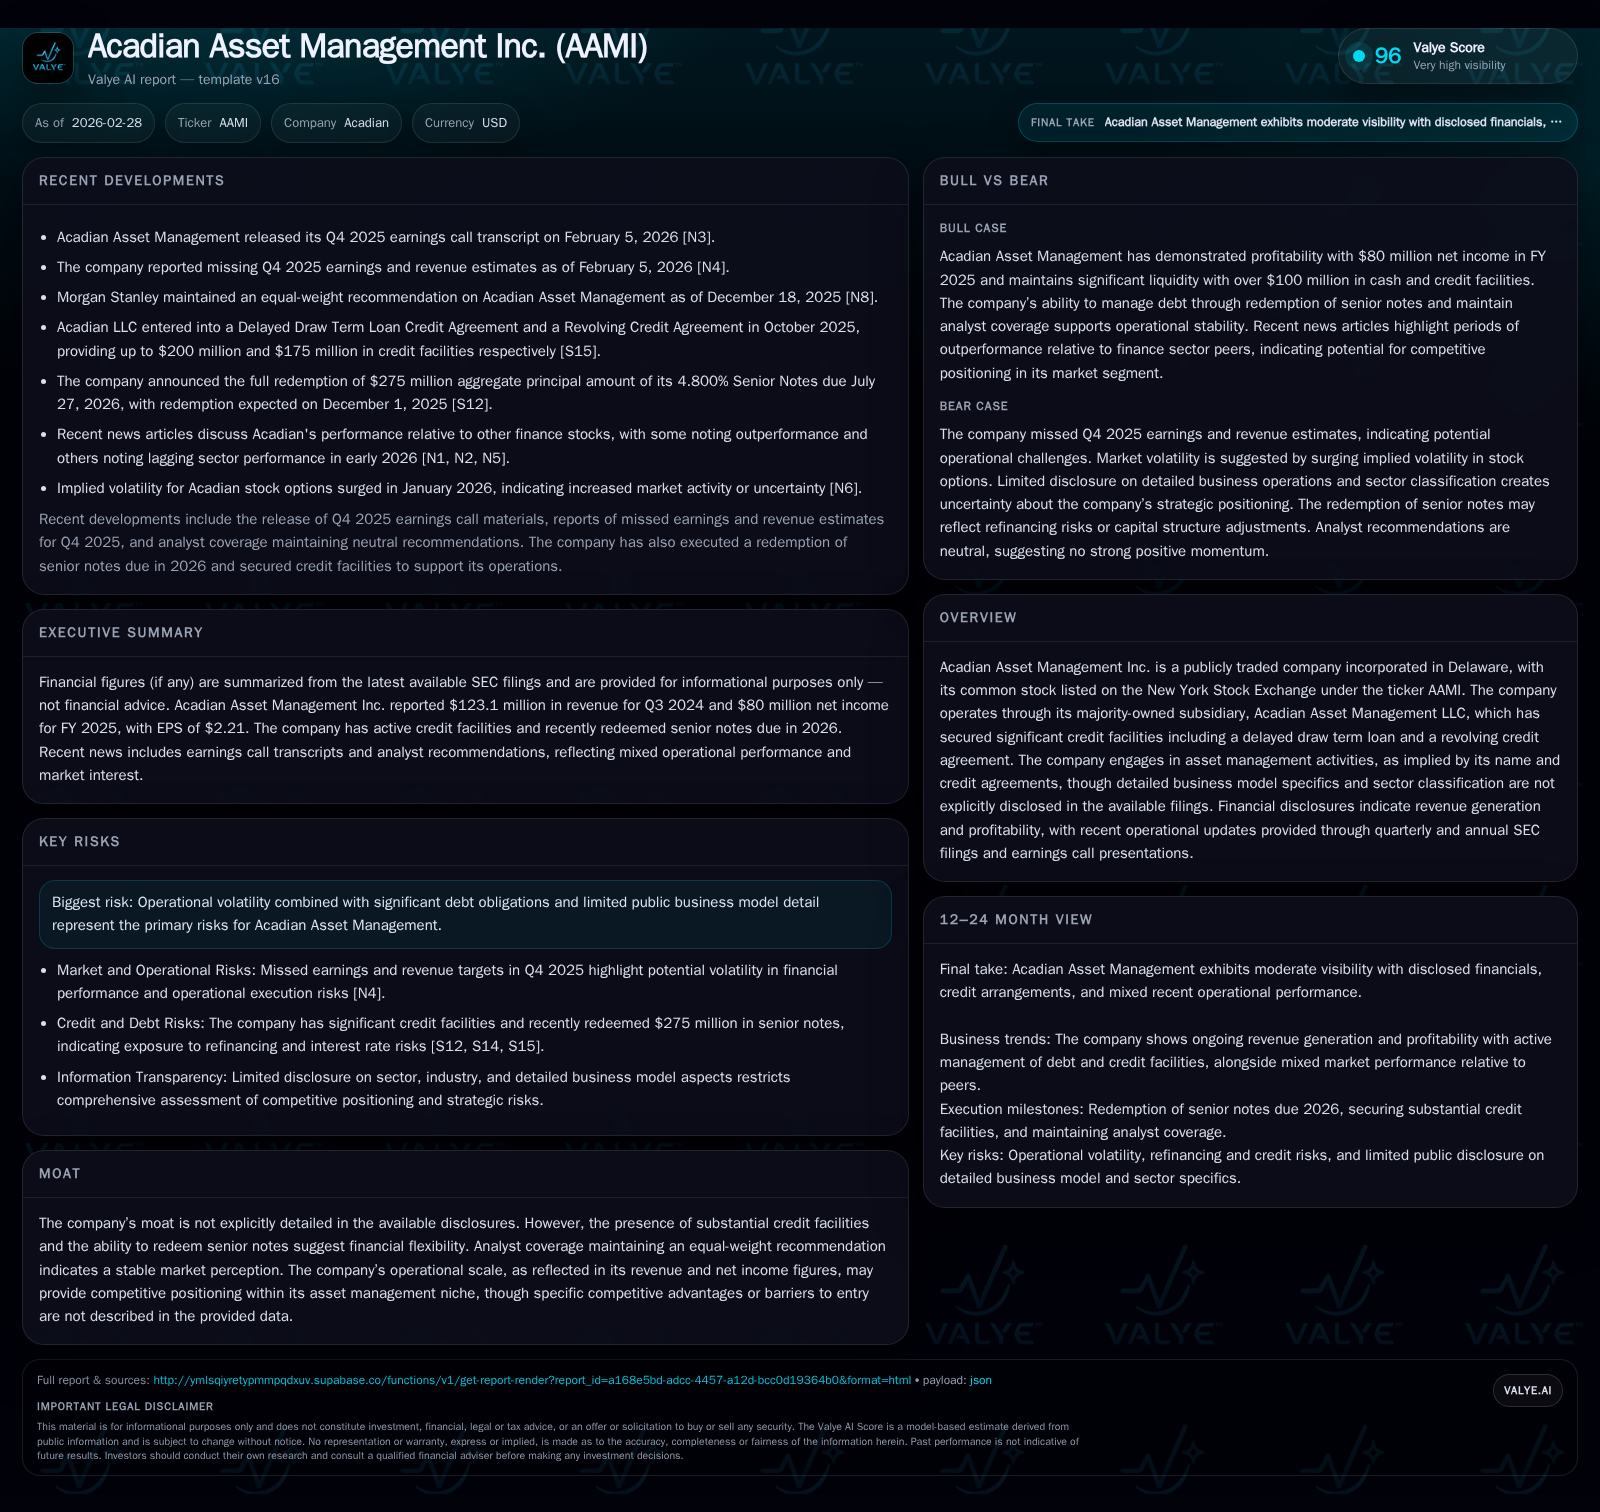
Acadian Asset Management Inc. experienced substantial revenue growth, rising from $122.7 million in 2022 to $426.6 million in 2023, with operating income reaching $132.1 million by 2025 [F1]. The company strategically refinanced its debt in late 2025 by entering a $200 million delayed draw term loan and a $175 million revolving credit facility, while redeeming $275 million of senior notes due in mid-2026 [S9][S10][S23]. Despite revenue growth, operating cash flow turned slightly negative in 2025 amid capital expenditures and working capital changes [F1]. Equity levels remain modest relative to earnings, reflecting elevated financial leverage risks as the company navigates refinancing and growth [F1].
Historical Performance and Growth Trajectory
Acadian Asset Management Inc. demonstrated exceptional revenue growth with top-line figures climbing from $122.7 million in FY2022 to approximately $426.6 million by FY2023, representing a nearly 248% increase year-over-year [F1]. This surge likely reflects significant asset inflows or fee structure enhancements. Operating income progressed from $47.9 million in FY2022 to $106 million in FY2023 and further stabilized at $132.1 million by FY2025, suggesting some margin compression amid scaling operations or reinvestment initiatives [F1].
Net income showed variability, peaking at roughly $100.6 million in FY2022 before declining to about $80 million in FY2025, highlighting earnings volatility potentially linked to market conditions or investment performance fees common within asset management sectors [F1].
Liquidity trends reveal that operating cash flows were robust through FY2023 and FY2024 but turned slightly negative at -$2.4 million in FY2025, indicating possible working capital fluctuations or increased capital deployment [F1]. The company's equity base remains modest at approximately $40.2 million as of FY2023-end compared to earnings power, resulting in an estimated return on equity near 199%, which underscores significant financial leverage within the capital structure [F1].
Historical performance (annual)
| FY | Rev ($mm) | Net ($mm) | CFO ($mm) | OpInc ($mm) | Rev YoY | Net YoY |
|---|---|---|---|---|---|---|
| 2025 | 80 | -2 | 132 | -5.9% | ||
| 2024 | 85 | 56 | 136 | +29.2% | ||
| 2023 | 427 | 66 | 68 | 106 | +247.7% | -34.6% |
| 2022 | 123 | 101 | 117 | 48 | -24.7% |
Source: SEC companyfacts cache [F1].
Capital returns and efficiency (annual)
| FY | Div ($) | Buybacks ($mm) | FCF ($mm) |
|---|---|---|---|
| 2025 | |||
| 2024 | |||
| 2023 | 800000 | 0 | 60 |
| 2022 | 800000 | 103 | 104 |
Source: SEC companyfacts cache [F1].
Note: Capital expenditures are partial data; dividends and buybacks reflect quarterly disclosures.
Capital Structure and Refinancing Initiatives
In late 2025, Acadian took decisive steps to manage refinancing risk related to its maturing debt obligations by entering into two major credit agreements on October 28: a Delayed Draw Term Loan Credit Agreement for up to $200 million and a Revolving Credit Agreement for up to $175 million, both maturing on October 28, 2028 [S9][S22]. These facilities carry interest rates based on Term SOFR plus applicable margins tied to leverage ratios.
Concurrently, the company announced the redemption of all outstanding senior notes totaling $275 million due July 27, 2026, completing the redemption transaction by early December at a premium price slightly above par [$1,004 per $1,000 principal] [S10][S14][S23]. This move effectively extends debt maturity profiles and reduces near-term refinancing pressures.
The credit agreements include standard covenants such as maintaining a maximum consolidated net leverage ratio not exceeding approximately 2.50x EBITDA and a minimum consolidated interest coverage ratio of about four times EBITDA on a trailing twelve-month basis [S5]. These provisions underscore the importance of sustaining earnings relative to indebtedness amid market uncertainties.
Market Positioning and Growth Outlook
While detailed disclosures on product lines or client segments are limited publicly, the rapid revenue expansion suggests successful strategies for client acquisition or fee model enhancements within its asset management operations [N1][N2]. The firm's scale now places it among mid-sized asset managers with credible financing arrangements supportive of potential future growth [S1].
Operational investments inferred from capital expenditure patterns indicate ongoing commitment to technology or infrastructure necessary for competitive positioning though specifics are not detailed [F1].
Risks and Financial Considerations
Elevated leverage presents ongoing risks given relatively low equity cushions against earnings volatility; compliance with financial covenants will be critical under changing market conditions [S4][S6][S7][S8]. Operational risks include dependency on sustained client inflows amidst competitive pressures and evolving regulatory environments typical for asset managers.
Capital Return and Shareholder Policies
After substantial share repurchases totaling approximately $103 million in FY2022, buybacks have ceased post-2023 with dividends remaining minimal around $0.8 million annually, reflecting conservative capital allocation favoring liquidity preservation during debt restructuring phases [F1]. Executive leadership continuity is maintained with recent CFO appointment supporting strategic execution [S21].
Outlook and Monitoring Points
Investors should watch for updates on:
- Operating margin developments amid margin pressures,
- Adjusted EBITDA trends relative to interest coverage under new credit terms,
- Cash flow normalization following refinancing activities,
- Potential shifts in shareholder distributions,
- Growth indicators from client assets under management or fee enhancements,
- Regulatory impacts affecting operational costs or reporting.
Overall, Acadian Asset Management’s recent financial maneuvers combined with strong historical revenue growth illustrate efforts to position the company for sustainable performance while navigating inherent leverage-related challenges.
This analysis is based exclusively on publicly available SEC filings ([S#]) , Nasdaq news articles ([N#]), and financial data snapshots ([F1]). No proprietary information or speculative forecasts are included.
Disclaimer: This is research-only, informational analysis and not investment advice. It may include AI-generated interpretation and general industry context. Always verify important details using primary sources.
Comments