
Asbury Automotive Expands Footprint Amid Margin Pressure and Inventory Challenges
Latest quarterly results reveal stable F&I per vehicle despite modest revenue decline and ongoing investments in omni-channel retail.
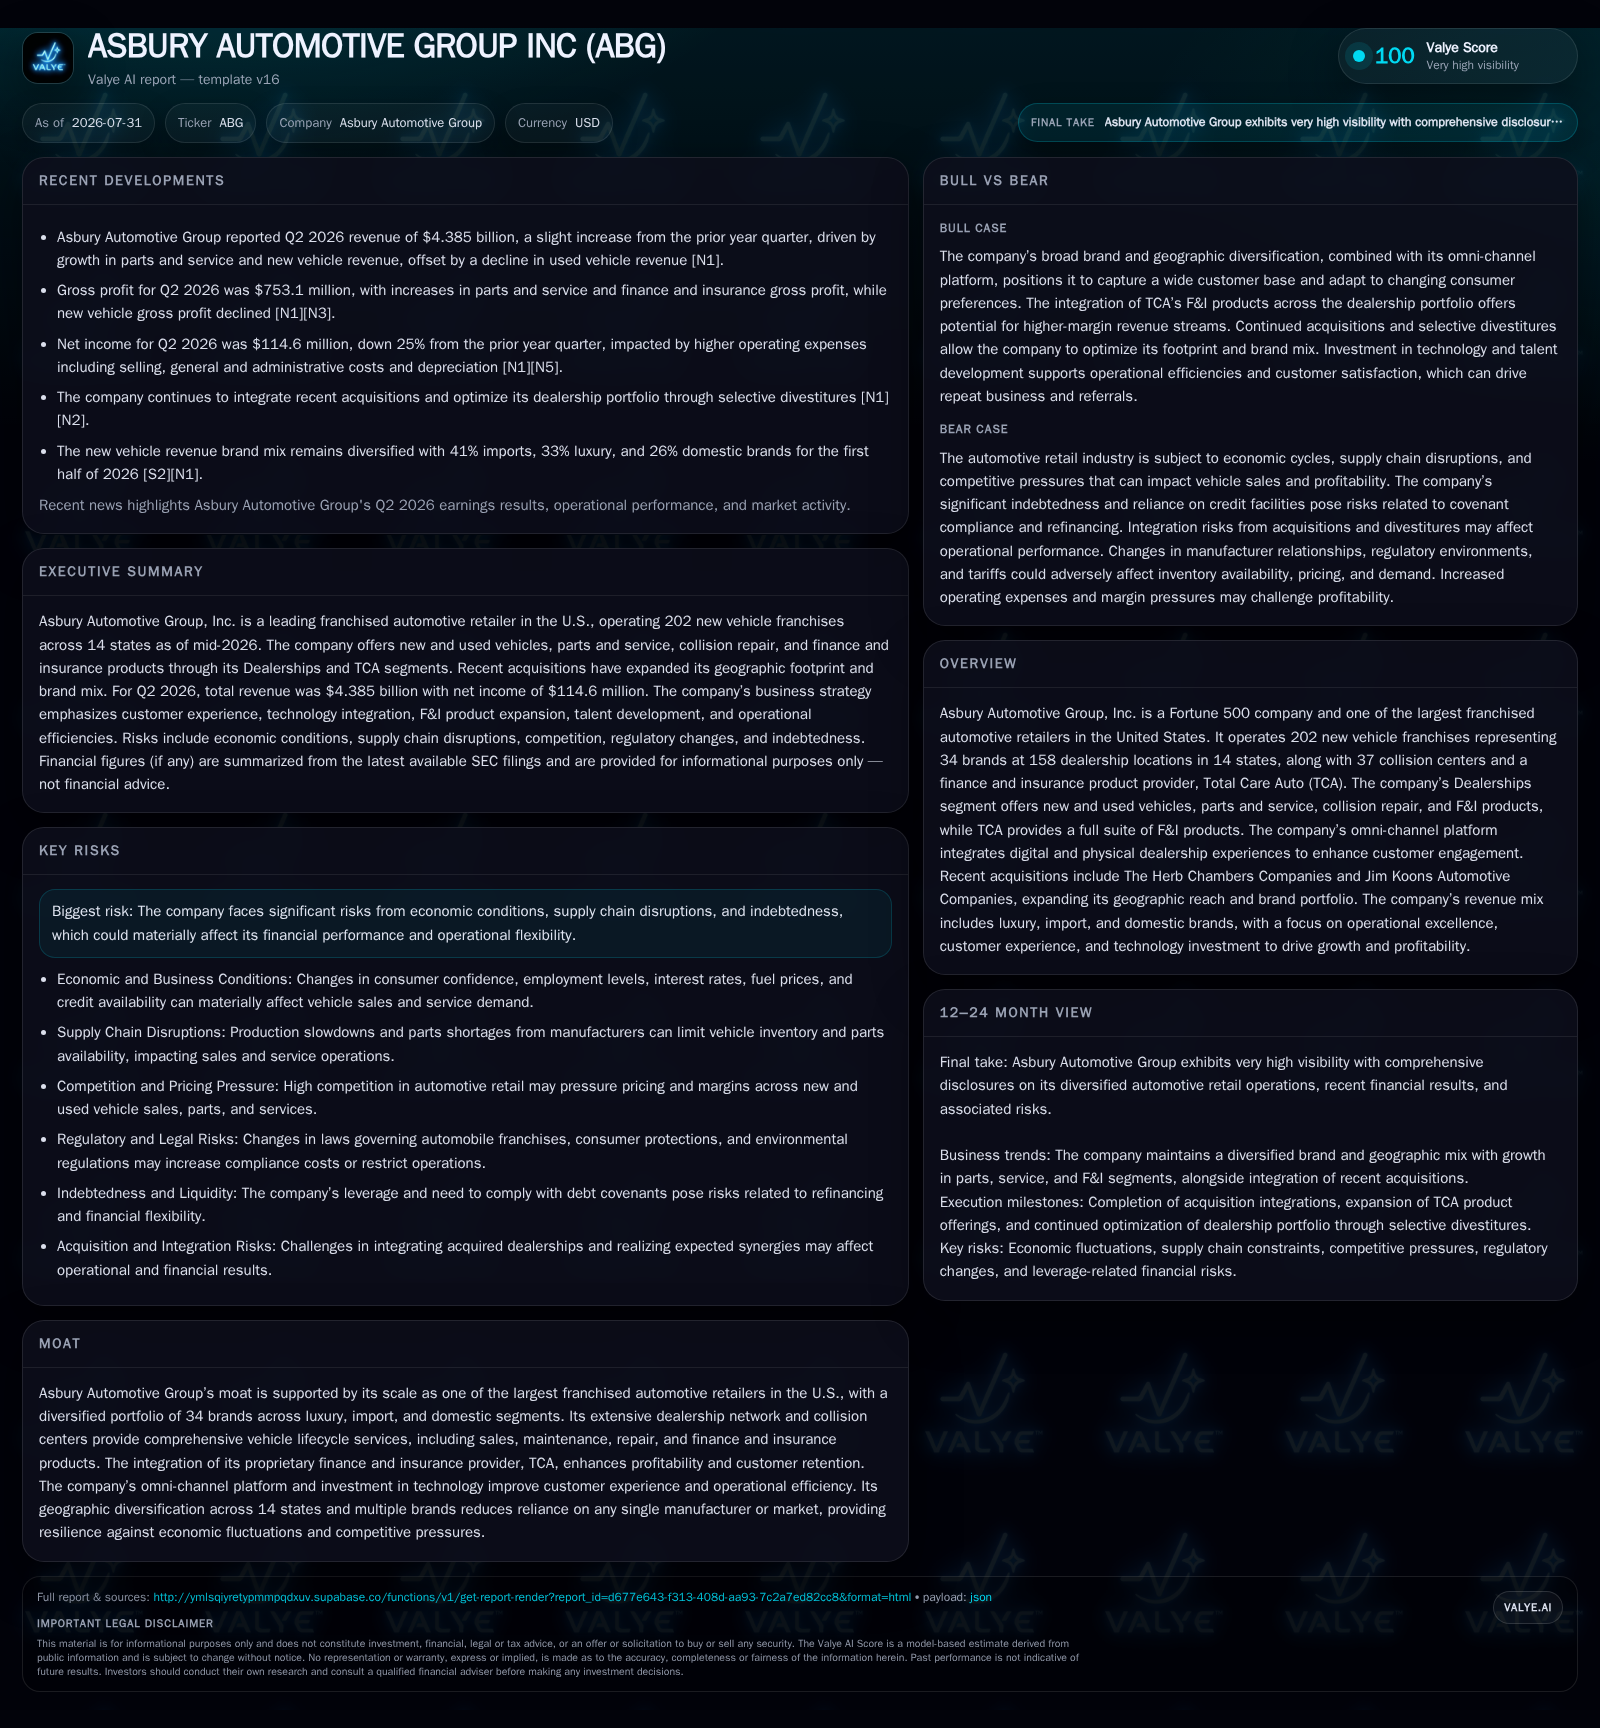
Asbury Automotive Group reported second-quarter operating results showing resilience in its finance and insurance (F&I) profitability per vehicle amid an 8% same-store sales decline in that segment. The company continues integrating its recent $1.76 billion Herb Chambers acquisition, which expanded its dealer portfolio to 36 brands across 171 locations. While new vehicle gross margins have softened from pandemic highs, gains in used vehicle profits and parts & service growth partially offset pressures. Elevated debt from acquisitions is managed with substantial liquidity and compliance with covenants.
Recent Operating Update: Q2 2026 Performance Highlights
The Q2 update also reflects integration progress following Asbury's July 2025 acquisition of The Herb Chambers Companies for $1.76 billion [S1]. This substantial deal expanded Asbury’s dealership footprint significantly across luxury, domestic, and import brands. As of December 31, 2025, Asbury operated 223 new vehicle franchises representing 36 brands at 171 locations across 15 states alongside a network of collision centers and Total Care Auto (TCA), their proprietary finance and insurance product provider [S1]. The diversification across brand types and geographies is intended to mitigate risks inherent in reliance on any single manufacturer or regional economic activity.
Business Model: Multi-Channel Automotive Retail with Integrated F&I
Asbury's revenue model stems primarily from its franchised Dealerships segment and its proprietary F&I business through TCA. Dealership revenues arise from new vehicle sales; used vehicles sold retail to consumers or wholesale at auctions; parts & service including maintenance, repair, collision services; plus F&I products such as extended warranties, GAP coverage, and prepaid maintenance [S1]. Revenue drivers are unit volumes coupled with margin per vehicle and incremental aftersales profitability.
Notably, used vehicles typically generate higher gross profit margins than new vehicles; likewise parts & service and F&I products command robust margins contributing to more stable earnings streams less sensitive to economic cycles than upfront car sales alone [S1]. During the COVID-19 pandemic period, new car gross margins temporarily spiked due to constrained supply creating dealer pricing premiums; recent filings indicate these margins have started normalizing downward albeit offset partly by gains in other segments [S1].
Importantly, TCA enhances profitability by selling high-margin insurance and protection products directly through Asbury's dealerships rather than relying solely on third-party providers [S1]. This vertically integrated approach helps boost recurring revenue streams and fosters stronger customer retention through an omni-channel platform blending physical dealership experiences with digital engagement tools designed to streamline transaction processes across the ownership lifecycle
Industry Structure and Competitive Position
Within the automotive retail sector — characterized by capital intensity due to inventory financing needs (floorplan loans), real estate ownership/leasing costs, and labor expenses — scale confers negotiating advantages on vehicle allocations from manufacturers as well as access to favorable financing terms. Asbury ranks among the largest publicly traded franchised automotive retailers alongside peers such as Lithia Motors and AutoNation.
Asbury's diversified brand portfolio spanning luxury (32%), imports (40%), and domestic lines (28%) provides a cushion against manufacturer-specific allocation volatility or demand shifts [S1]. Similarly geographic diversification across approximately half of U.S. states served by competitors limits exposure to localized downturns.
Operational efficiency is monitored through KPIs including gross profit per new and used vehicle sold, parts & service gross profit growth rates (9% YoY in FY25), F&I attach rates, same store sales growth metrics, and inventory days on hand [S1]. The company's emphasis on combining scale with technology-enabled omni-channel platforms also aims at improving customer acquisition/conversion rates relative to traditional single-channel dealers.
Growth Drivers
Key growth catalysts include:
- Continued acquisitions expanding footprint notably the Herb Chambers purchase added substantial dealer counts enhancing brand representation.
- Expansion of parts & service revenue through higher penetration of collision repairs and aftermarket products which benefit from steady demand relatively insulated from new vehicle sales fluctuations.
- Growth in F&I product attach rates leveraging proprietary TCA offerings enhances margin capture opportunities beyond core sales volumes.
- Digital transformation initiatives improving online sales capabilities bolster capture of younger digitally savvy buyers preferring omni-channel experiences.
- Geographic expansion into underserved markets supporting incremental market share gains.
The rising average age of vehicles on roads nationally supports parts & service longevity while evolving consumer preference for bundled dealership experiences incentivizes retention-focused cross-selling around finance/insurance packages.
Risks / Watchpoints
Despite strategic strengths, Asbury faces key risks:
- Economic downturns or inflationary pressures could depress demand for discretionary big-ticket purchases like vehicles impacting volumes disproportionately.
- Supply chain constraints remain a concern; limited inventory availability undermines new car sales potential along with margin compression post-pandemic premium window.
- Elevated indebtedness following recent acquisitions increases interest expense exposure ($94.6 million interest cost over six months ended June 30, 2026) requiring prudent liquidity management [S2].
- Regulatory developments influencing finance & insurance product compliance could raise costs or constrain offerings.
- Competitive encroachment from direct-to-consumer manufacturers or robust online marketplaces demands continual digital platform enhancements for competitiveness.
- Integration risks related to assimilating acquired dealerships smoothly without disrupting operational efficiencies or customer experience.
Management cites maintaining leverage goals within targeted net leverage ratio bands of approximately 2.5x–3.5x adjusted EBITDA as a priority alongside optimizing capital allocation between acquisitions, organic investment, and share repurchases [S1]
What to Watch Next
Near-term monitoring points include:
- Quarterly same store sales trends for new vs used vehicles reflecting ongoing macroeconomic impact on consumer purchasing behavior.
- F&I attach rate progression measuring success of TCA’s offering enhancements amid market pressures.
- Parts & service gross profit growth indicating sustained traction in aftersales excellence initiatives.
- Progress on refinancing maturing real estate facilities scheduled end of calendar year 2026 providing clarity on cost of capital management.
- Share repurchase cadence reflecting confidence level underpinning cash flow strength as significant buybacks ($277.6 million YTD) resumed during early H1 2026 [S2].
- Inventory turnover improvements assessing supply chain recovery versus potential overstock risks affecting floorplan interest costs.
Financial Profile Discussion
As of June 30, 2026, Asbury held total liquidity approximating $966.5 million comprising modest cash balances ($4.8 million excluding TCA holdings), short-term investments ($5.3 million), floorplan offset accounts ($144.3 million), availability under revolving credit facilities ($782 million), plus additional floor plan facility capacity [S4]. This liquidity profile underpins working capital needs critical in heavily financed inventory operations vital for meeting consumer demand promptly.
Interest expense rose proportionally owing primarily to mortgage facilities linked to real estate acquisitions tied to Herb Chambers integration ($7 million incremental mortgage interest plus $2.5 million credit facility interest) [S2]. Capital allocation has focused actively on shareholder returns evidenced by robust share repurchases amounting to $130.6 million for Q2 alone and over $277 million for six months ended June totaling more than double prior-year repurchase activity highlighting management’s confidence backed by stable cash flows despite cyclical headwinds [S2]
Disclaimer: This is research-only, informational analysis and not investment advice. It may include AI-generated interpretation and general industry context. Always verify important details using primary sources.

Comments