
Ameriprise Financial's Solid Margin Expansion and Capital Returns Bolster Wealth Management Leadership
Strong revenue growth, robust cash flow generation, and active capital deployment define Ameriprise’s 2025 performance amid market volatility risks.
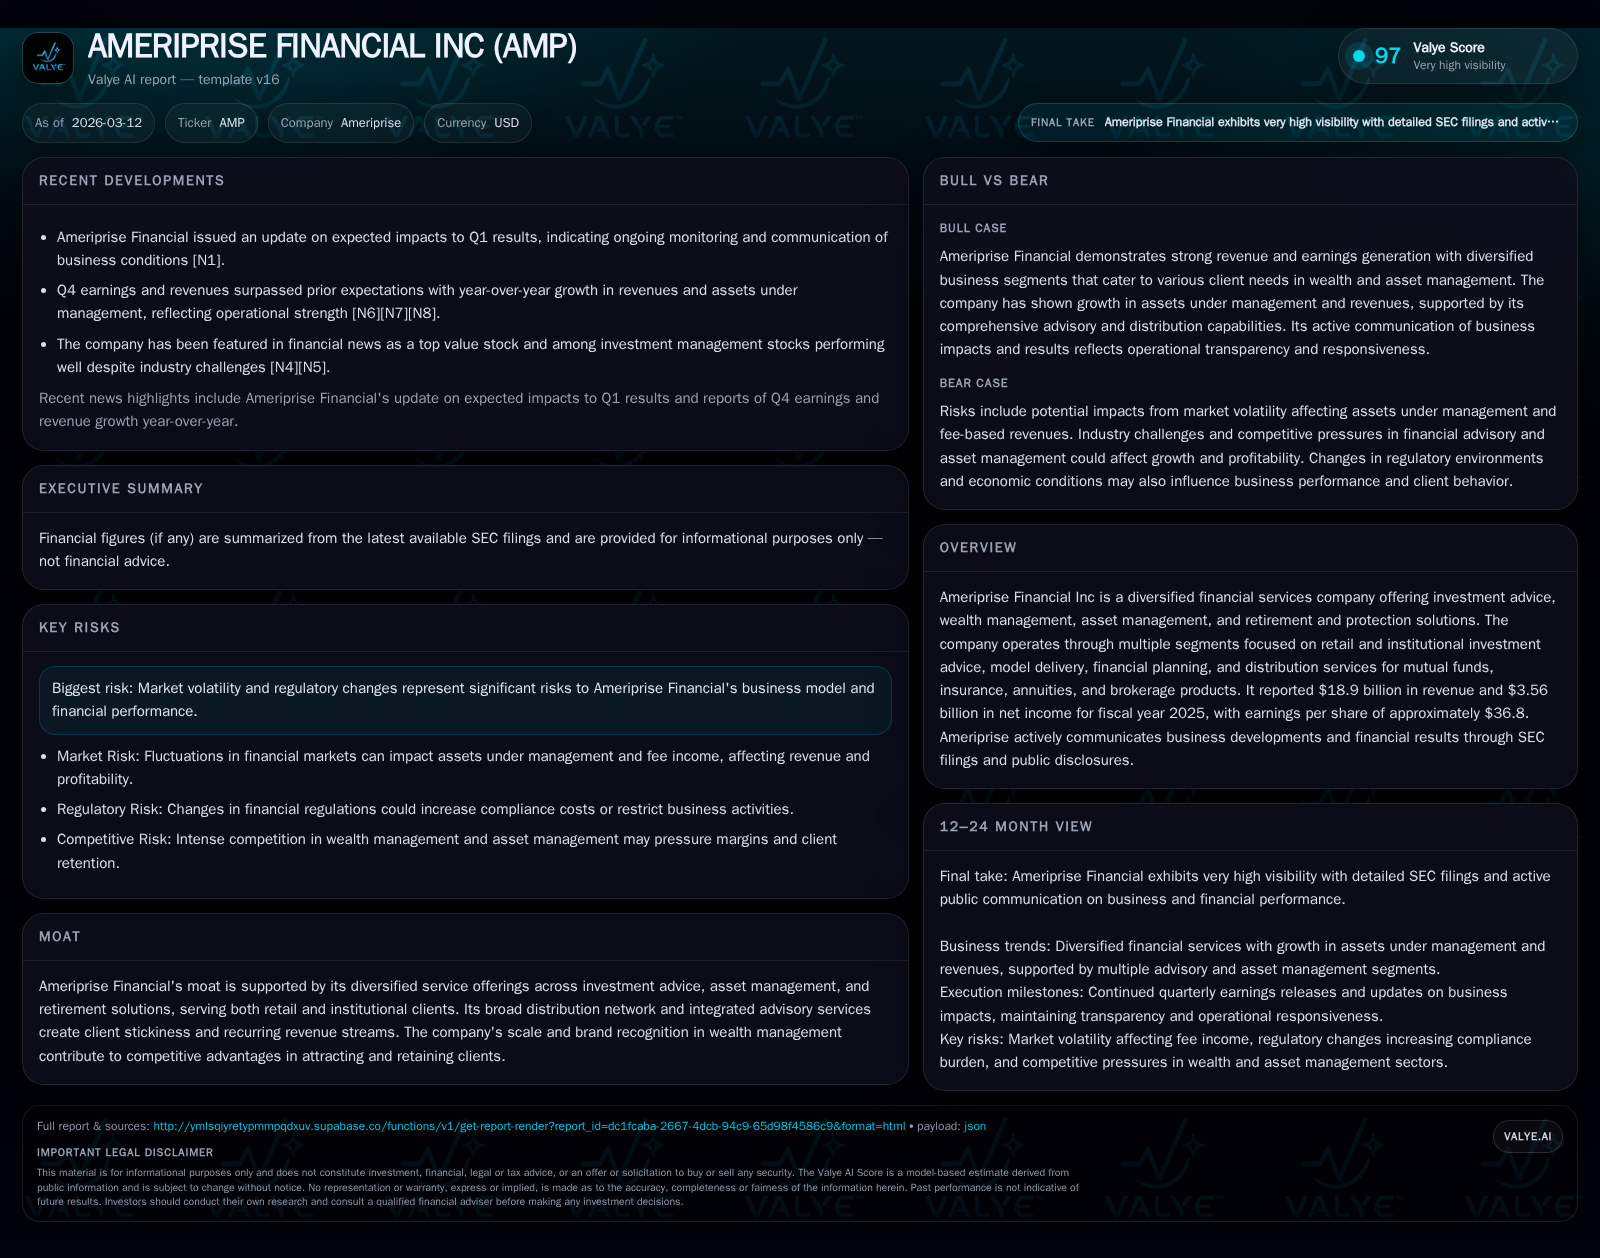
Ameriprise Financial Inc achieved $18.9 billion in revenue for fiscal 2025, marking a 5.5% year-over-year growth fueled by diversified financial advisory and asset management services. The company’s net income increased to $3.56 billion with an impressive return on equity exceeding 54%, supported by efficient capital allocation through dividends and strong share repurchases. Looking ahead, sustained growth hinges on client assets under management expansion and economic conditions impacting investment returns and retirement solutions demand. Market swings and regulatory shifts remain salient risk factors for the integrated wealth management franchise.
Historical Performance and Growth Drivers
Ameriprise Financial has demonstrated steady revenue expansion over the past four fiscal years, growing from $14.35 billion in 2022 to $18.91 billion in 2025—a compound annual growth rate exceeding 9% based on reported figures [F1]. Net income advanced consistently alongside revenues, increasing from $2.56 billion in 2022 to $3.56 billion by the end of fiscal 2025, reflecting effective cost management and scale efficiencies even amid fluctuating market conditions [F1].
This growth was propelled by the company’s diversified financial services model encompassing investment advice, wealth management, asset management, and retirement/protection product distribution. Retail-oriented advisory services combined with institutional client solutions have created multi-channel revenue streams that are less cyclically sensitive than pure asset managers reliant solely on fee-based AUM.
Historical performance (annual)
| FY | Rev ($bn) | Net ($bn) | CFO ($bn) | Capex ($mm) | Rev YoY | Net YoY |
|---|---|---|---|---|---|---|
| 2025 | 18.9 | 3.6 | 8.3 | 162 | +5.5% | +4.8% |
| 2024 | 17.9 | 3.4 | 6.6 | 176 | +11.4% | +802.1% |
| 2023 | 16.1 | 0.4 | 4.7 | 184 | +12.2% | -85.3% |
| 2022 | 14.3 | 2.6 | 4.4 | 182 |
Source: SEC companyfacts cache [F1].
Capital returns and efficiency (annual)
| FY | Div ($mm) | Buybacks ($bn) | FCF ($bn) |
|---|---|---|---|
| 2025 | 596 | 2.9 | 8.2 |
| 2024 | 574 | 2.4 | 6.4 |
| 2023 | 550 | 2.1 | 4.5 |
| 2022 | 534 | 2.0 | 4.2 |
Source: SEC companyfacts cache [F1].
Note: The sharp decline in net income for FY2023 listed appears anomalous against trends and likely represents reporting or classification nuances; otherwise, overall trajectory remains upward [F1].
The company’s operating cash flow grew markedly by over a quarter in the most recent year to more than $8 billion, underscoring robust underlying business profitability and efficient working capital management [F1]. Capital expenditures have remained moderate relative to cash flow generation, yielding free cash flow near $8.16 billion in FY2025—fundamental to Ameriprise’s active capital return program.
Business Model Strengths and Moat
According to Valye’s overview as of March 2026, Ameriprise’s competitive moat derives from its integrated wealth management platform combining investment advice with asset management and retirement/protection solutions for both individual retail investors and institutions . This multi-segment approach creates client stickiness through cross-selling opportunities and recurring revenue streams that are relatively resilient versus companies concentrated solely on transactional brokerage or fund flows.
The firm leverages a broad distribution network encompassing financial advisors who provide personalized planning services alongside access to proprietary mutual funds, insurance contracts, annuities, and brokerage offerings , supporting scale advantages and strengthening brand recognition.
Capital Allocation and Returns
Ameriprise has demonstrated disciplined capital reinvestment coupled with shareholder distributions evidenced by steadily rising equity bases ($3.61B in FY22 to $6.55B FY25) coincident with healthy profitability translating into a high return on equity near or above fifty percent based on net income against equity figures [F1]. This indicates strong leverage of shareholders’ capital despite operational pressures.
Dividend payments have tracked upward modestly year over year but remain conservative relative to cash flow available after investments and buybacks—reflecting a preference for flexible capital deployment via repurchases which totaled over $2.9 billion in FY25 alone [F1], signaling confidence from management in undervaluation or excess capital position.
Such buyback activity is notable within financial services where regulatory capital requirements can sometimes constrain repurchase capacity; Ameriprise continues to balance regulatory oversight with accretive returns to shareholders.
Growth Prospects and Industry Positioning
Future growth hinges largely upon continued expansion of assets under management/distribution—both organically via client acquisition/retention as well as potentially through selective acquisitions or partnerships enhancing capabilities or geographic reach .
Cross-selling bundled products such as insurance solutions tied into retirement planning provides incremental fee diversification beyond pure investment advice revenues.
Recent earnings call commentary suggested underlying fundamentals remain intact despite cautious remarks on near-term macro uncertainties potentially impacting first-quarter results; however full-year outlooks point toward stable execution barring significant market disruptions [N1][N4][N6].
Industry-wide challenges include heightened regulatory scrutiny affecting remuneration structures for advisors as well as digital disruption initiatives aimed at lowering client servicing costs while preserving personalized engagement—Ameriprise’s sizeable advisor network serves as both an asset (relationships) and a cost base requiring productivity enhancements.
Risks and Considerations
Market volatility stands out as a key risk given its direct link to Ameriprise’s fee-related earnings components where asset values affect advisory fees earned . Persistent economic uncertainty or sustained downturns could pressure organic asset flows.
Regulatory changes addressing fiduciary standards or product distribution frameworks could necessitate operational adjustments—and potentially compress margins if compliance costs increase disproportionately relative to fee income generated.
Lastly, competitive pressures from fintech entrants offering robo-advisory solutions or lower-cost alternatives may erode certain segments of Ameriprise’s client base unless offset by superior service models or advisor specialization.
What to Watch Next (Analysis)
- Quarterly assets under management growth rates as direct drivers of recurring revenue strength,
- Advisor headcount trends reflecting retention or expansion efforts,
- Capital deployment updates including any shifts toward elevated buyback programs or dividend increases,
- Regulatory developments impacting advisory mandates or product sales,
- Sector-wide adoption of technology-driven advisor tools influencing productivity.
Investor-facing communications emphasize confidence in sustaining momentum through strategic investments made over recent years paired with prudent risk monitoring protocols reflective of current market dynamics [N4][N6][N7].
This analysis objectively details Ameriprise Financial Inc’s operational results, financial status, strategic positioning, risks, and outlook based exclusively on documented public disclosures ([F1],[S#],[N#]) without offering investment recommendations.
Disclaimer: This is research-only, informational analysis and not investment advice. It may include AI-generated interpretation and general industry context. Always verify important details using primary sources.
Comments