
Silvaco Group Advances Semiconductor Design Innovation Despite Profitability Challenges
Silvaco's integration of AI-driven semiconductor design software and strategic acquisitions drive revenue gains alongside persistent operating losses.
Silvaco Group, Inc. leverages its artificial intelligence-powered TCAD software and a recently expanded semiconductor IP portfolio through acquisitions to fuel revenue growth. Despite increasing top-line performance driven by enhanced product offerings and global customer diversification, the company continues to face significant operating losses exacerbated by elevated R&D investments and litigation expenses. Silvaco's capital allocation emphasizes innovation and strategic market expansion while managing cash flow pressures amid competitive and geopolitical risks.
Evolution of Silvaco’s Growth Trajectory: Revenue and Technology Drivers
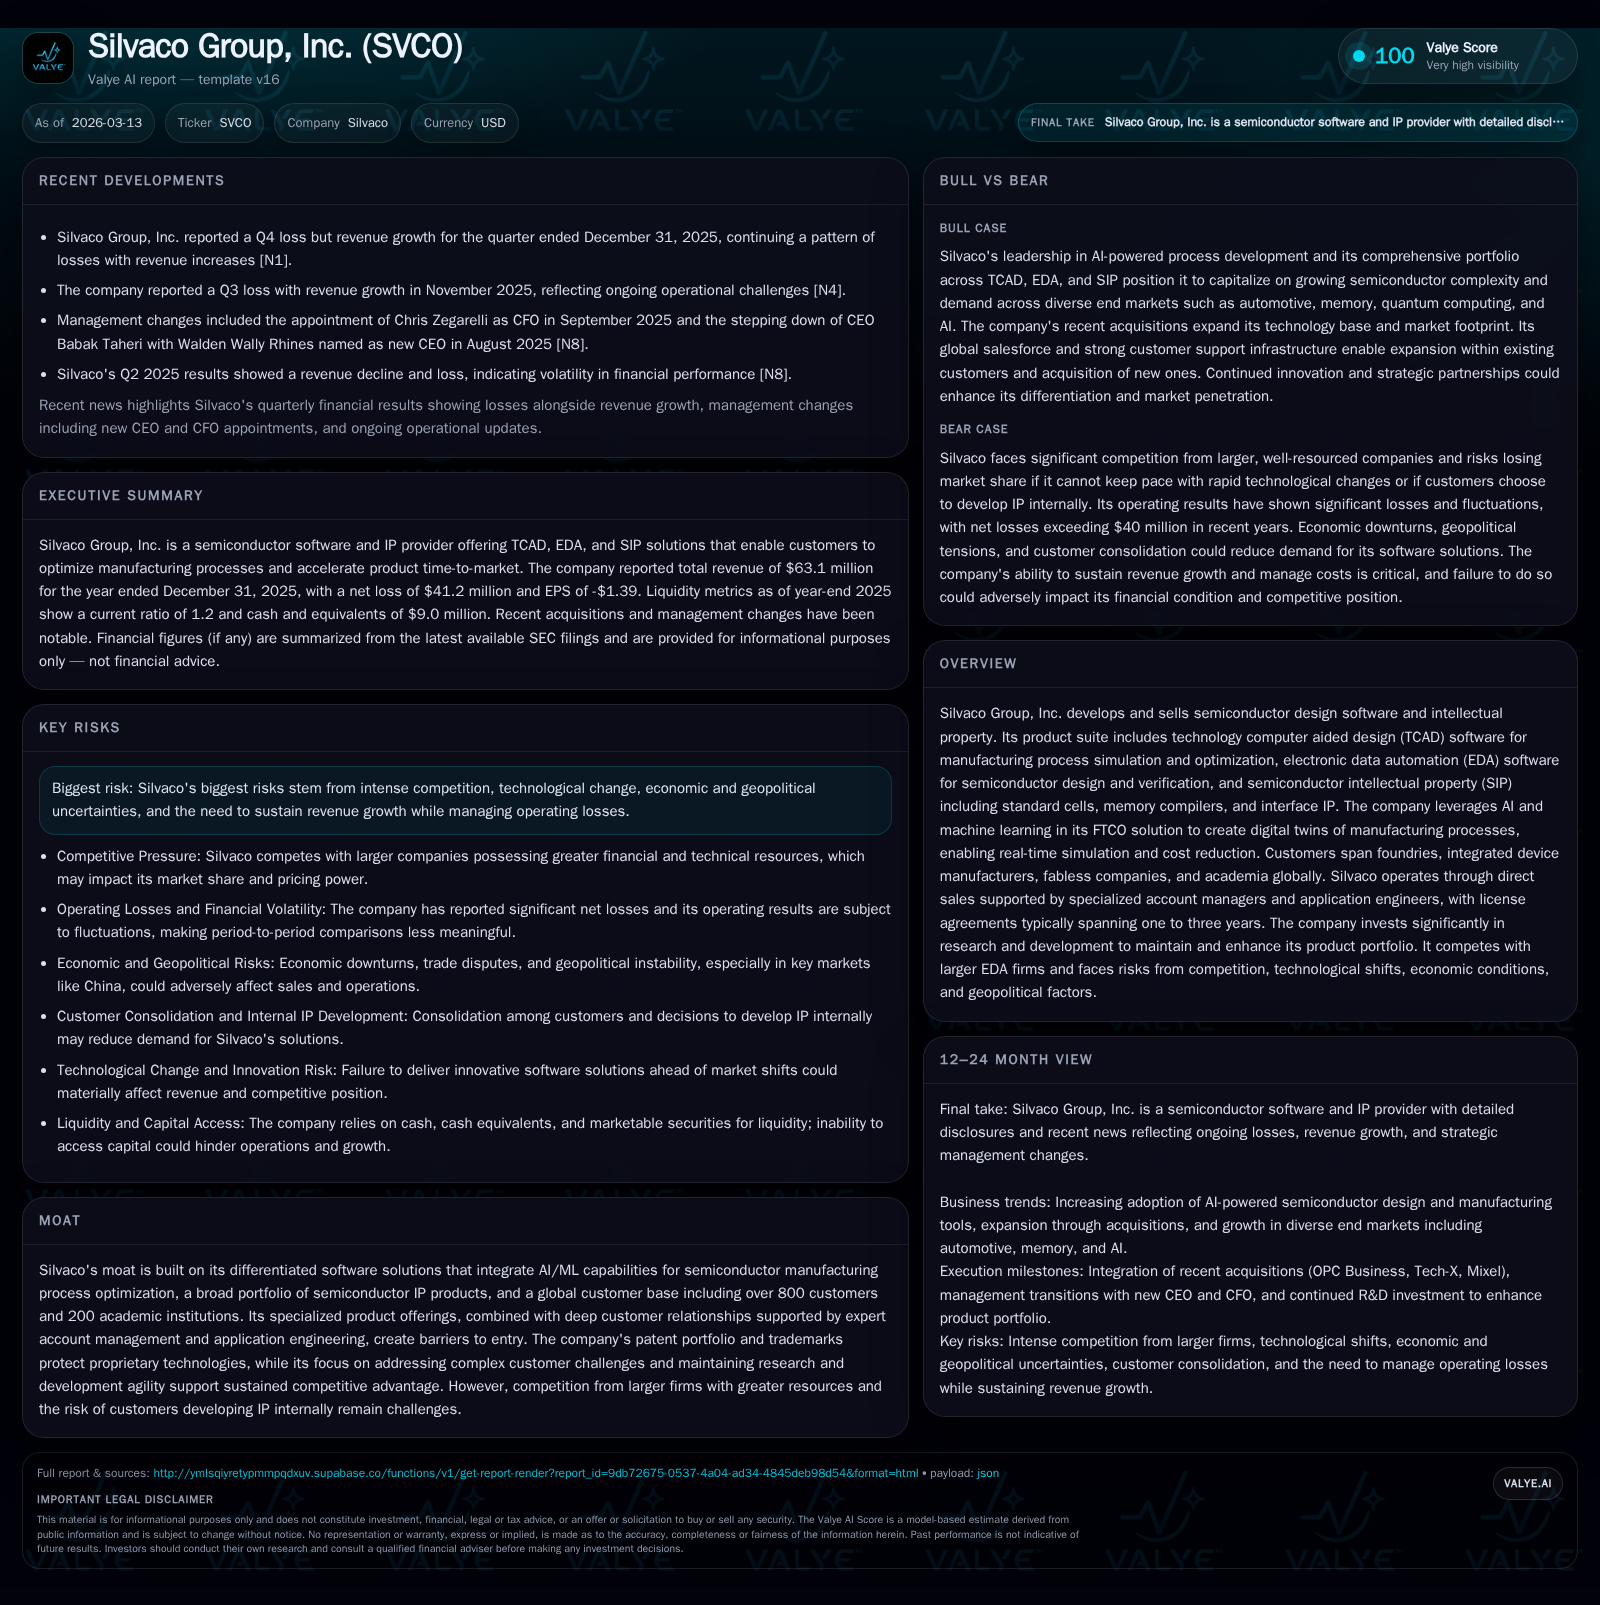
Silvaco Group operates at the intersection of semiconductor design software innovation and manufacturing process optimization. The company’s core product segments — technology computer aided design (TCAD), electronic data automation (EDA), and semiconductor intellectual property (SIP) — collectively underpin its fiscal performance. In FY2025, Silvaco reported revenues of $63.1 million, representing a 6% increase over $59.7 million in FY2024 [F1]. This growth is driven primarily by adoption of its AI-enhanced Fab Technology Co-Optimization (FTCO) suite within TCAD solutions. FTCO employs machine learning models to create digital twins that enable real-time simulation of fab processes, reducing trial-and-error cycles for customers including foundries and integrated device manufacturers (IDMs) [S1].
Electronics data automation revenue benefited from enhancements in SPICE modeling, parasitic extraction tools, and optical proximity correction — tools essential for complex node pattern fidelity. Meanwhile, SIP offerings grew following acquisitions such as Mixel which added standard cells, memory compilers, and interface IP products integral for SoC designs [S1]. Software licenses accounted for roughly 68% of total revenue in FY2025 with maintenance and service revenue comprising the remainder; a shift from 74% license share in FY2024 reflects growing post-contract support uptake [S1][S4]. This recurring revenue mix supports longer-term visibility yet faces variable renewal timing dependent upon licensing agreements typically spanning one- to three-year terms [S5].
Leveraging AI & M&A to Expand Product Portfolio and Market Reach
Silvaco recent years have been marked by strategic inorganic moves aimed at deepening its technical portfolio. In March 2025, it acquired Cadence Design Systems’ Process Proximity Compensation asset line — an optical proximity correction (OPC) toolset essential for sub-10nm lithography accuracy — for $11.5 million cash consideration [S1]. This acquisition complements Silvaco’s EDA products providing end-to-end solutions integrating AI capabilities to optimize manufacturing protocols. Shortly thereafter in April 2025, Silvaco expanded further into physics-based simulation via full acquisition of Tech-X Corporation for $8.2 million paid through a combination of cash, equity shares valued at $2.4 million at closing date, plus contingent consideration based on milestone achievements [S1].
These deals bolster Silvaco’s SIP portfolio with quality processes transitioned from acquired entities across the organization as part of integration efforts aimed at realizing cross-selling synergies globally [S1]. The firm positions itself as an early pioneer leveraging AI/ML in Fab Technology Co-Optimization workflows that align device design rules with manufacturing realities — a critical capability as semiconductor nodes push boundaries where lithography distortions become increasingly complex [S1].
Assessing Financial Performance: Operating Losses Amid Topline Gains
Despite tangible topline improvements, Silvaco’s financial metrics underscore ongoing operational headwinds. The firm recorded an operating loss of approximately $45.9 million in FY2025 versus a $40.3 million loss in FY2024 — a 13.9% deterioration year-over-year reflecting stepped-up spending [F1]. Net loss similarly widened modestly by 4.6% to $41.2 million for FY2025 [F1]. The cost structure evidences heightened investment particularly in research & development which surged 44% propelled by increased headcount costs and R&D initiatives supporting AI-enablement as well as acquired technology integration [S21]. Selling & marketing expenses held steady around $18.3 million while general & administrative expenses declined slightly [S21].
Litigation settlements related to historical contract disputes added more than $13 million in FY2025 operational charges further pressuring margins [S7][S21]. Gross profit margin contracted slightly from prior periods attributable chiefly to increased personnel costs directly supporting customer success functions embedded within cost of revenue [S19][S21].
Operating cash flow weakened substantially to negative $33.9 million in FY2025 from negative $19.8 million previously due to escalated net losses combined with working capital fluctuations primarily involving accrued liabilities and accounts receivable [F1][S16]. After accounting for capital expenditures near $0.6 million — which rose moderately year-over-year — free cash flow remains deeply negative at approximately -$34.5 million per annum indicating ongoing external financing reliance or capital injections are necessary absent rapid profitability improvement [F1].
Historical Financial Performance ($000s)
Historical performance (annual)
| FY | Net ($mm) | CFO ($mm) | OpInc ($mm) | Capex ($) | Net YoY |
|---|---|---|---|---|---|
| 2025 | -41 | -34 | -46 | 618000 | -4.6% |
| 2024 | -39 | -20 | -40 | 505000 |
Source: SEC companyfacts cache [F1].
Capital returns and efficiency (annual)
| FY | FCF ($mm) | ROE% |
|---|---|---|
| 2025 | -35 | -54.9 |
| 2024 | -20 | -39.4 |
Source: SEC companyfacts cache [F1].
Customer Base Diversification and Global Sales Strategy
Silvaco maintains a robust global footprint serving over 800 customers worldwide including more than 200 academic institutions that leverage its software solutions for commercial R&D and pedagogy [S5]. Geographic revenue breakdown shows Asia representing the majority with about 54%, followed by the Americas at nearly 38%, and Europe rounding out with approximately 8% as of FY2025 end [S5][S6]. Leading Asian markets include China (approx. $12.3M revenue), Japan ($6.1M), Korea ($7M), Taiwan ($6.8M) alongside substantial U.S.-based sales ($23.3M) illustrating broad market penetration across key semiconductor hubs [S6].
The company deploys an account management model tailored for technical complexity requiring specialized knowledge along with field applications engineers supporting solution adoption throughout customers’ chip design life cycles — spanning six-to-nine months for TCAD/EDA projects versus three-to-nine months for SIP deals [S5][S6]. License contracts generally range from one- to three-year durations offering moderate revenue visibility although renewals require proactive engagement beginning six to twelve months prior to expiration encouraging steady upgrades or expansions where applicable [S5]. Sales operations include direct channels reinforced with distributors targeting emerging markets including Israel, India, Southeast Asia — regions viewed as growth engines despite heightened geopolitical risk profiles [S5][S22].
Capital Allocation: Investments in R&D, Cash Flows, and Returns
Innovation remains central to Silvaco’s resource deployment evidenced by the substantial uplift in research & development expenditure reaching almost $30 million in FY2025 versus just above $20 million the prior year—a prioritized spend category fueling AI advancements and software extensibility aligned with evolving semiconductor process technologies [S8][S21]. Capital expenditures remain modest at slightly above $600 thousand annually reflecting largely sustaining investments rather than large-scale infrastructure buildouts or hardware acquisitions characteristic of fab-centric firms [F1][S28].
Liquidity remains cautious with cash and equivalents settling around $9 million at year-end while current assets exceed current liabilities producing a current ratio near 1.2 indicating adequate short-term coverage albeit without significant buffer given cash burn rates [F1][S10][S16]. Equity declined sharply year-over-year from about $100 million down to approximately $75 million consistent with accumulated losses diminishing net book value [F1]. No dividend payments or share buybacks were reported highlighting management’s focus on reinvestment rather than capital returns under current financial pressures.
Risks from Competition and Geopolitical Headwinds
Silvaco operates within an intensely competitive landscape dominated by well-capitalized incumbents possessing expansive R&D budgets able to develop proprietary IP internally potentially crowding out third-party suppliers like Silvaco [S7][S15]. The moat afforded by specialized AI-driven process optimization solutions is challenged by rapid technological change necessitating continual innovation; failure risks market share erosion coupled with pricing pressure.
Geopolitical dynamics particularly affecting Asian markets introduce exposure risks through trade restrictions, export controls governed by BIS regulations impacting license distribution internationally, currency fluctuations affecting reported revenues originating outside USD bases plus compliance burdens arising from evolving data privacy regimes all impose operational complexity on the firm’s global sales efforts [S7][S15][S20][S22]. Ongoing litigation contingencies relating to intellectual property or contractual claims add financial uncertainty despite favorable appeal rulings minimizing immediate charges [S7][S15].[N1]
What to Watch: Upcoming Milestones and Growth Catalysts
While explicit forward guidance is limited publicly due primarily to variable sales cycles across product lines, investors should monitor Silvaco's progress on integrating acquired OPC and Tech-X technologies into unified platforms enhancing cross-selling opportunities—a critical validation point for deal accretion thesis linked to expanded SIP capability sets [N1][S3].
Renewal rates on multi-year licenses coupled with increasing maintenance revenue proportions will serve as leading indicators of customer retention amid escalating competitive threats. Observers should also track whether scaling operating expenses begin decoupling proportionally from revenues facilitating operating margin expansion as projected by management headroom assumptions. Finally, advancement milestones associated with FTCO deployments into next-generation node fabs could materially enhance credibility underpinning sustained demand growth.
This analysis synthesizes publicly available information including company SEC filings up through March 12, 2026 ([F1], [S#]) supplemented with recent earnings press releases ([N1]). The content aims solely to inform on Silvaco Group’s operational context without conveying investment advice or recommendations.
Disclaimer: This is research-only, informational analysis and not investment advice. It may include AI-generated interpretation and general industry context. Always verify important details using primary sources.
Comments