
Andersons’ Multi-Segment Revenue Pressure and Renewables Adjustment in 2025
Examining Andersons, Inc.'s mixed financial performance driven by commodity volatility and ethanol segment consolidation.
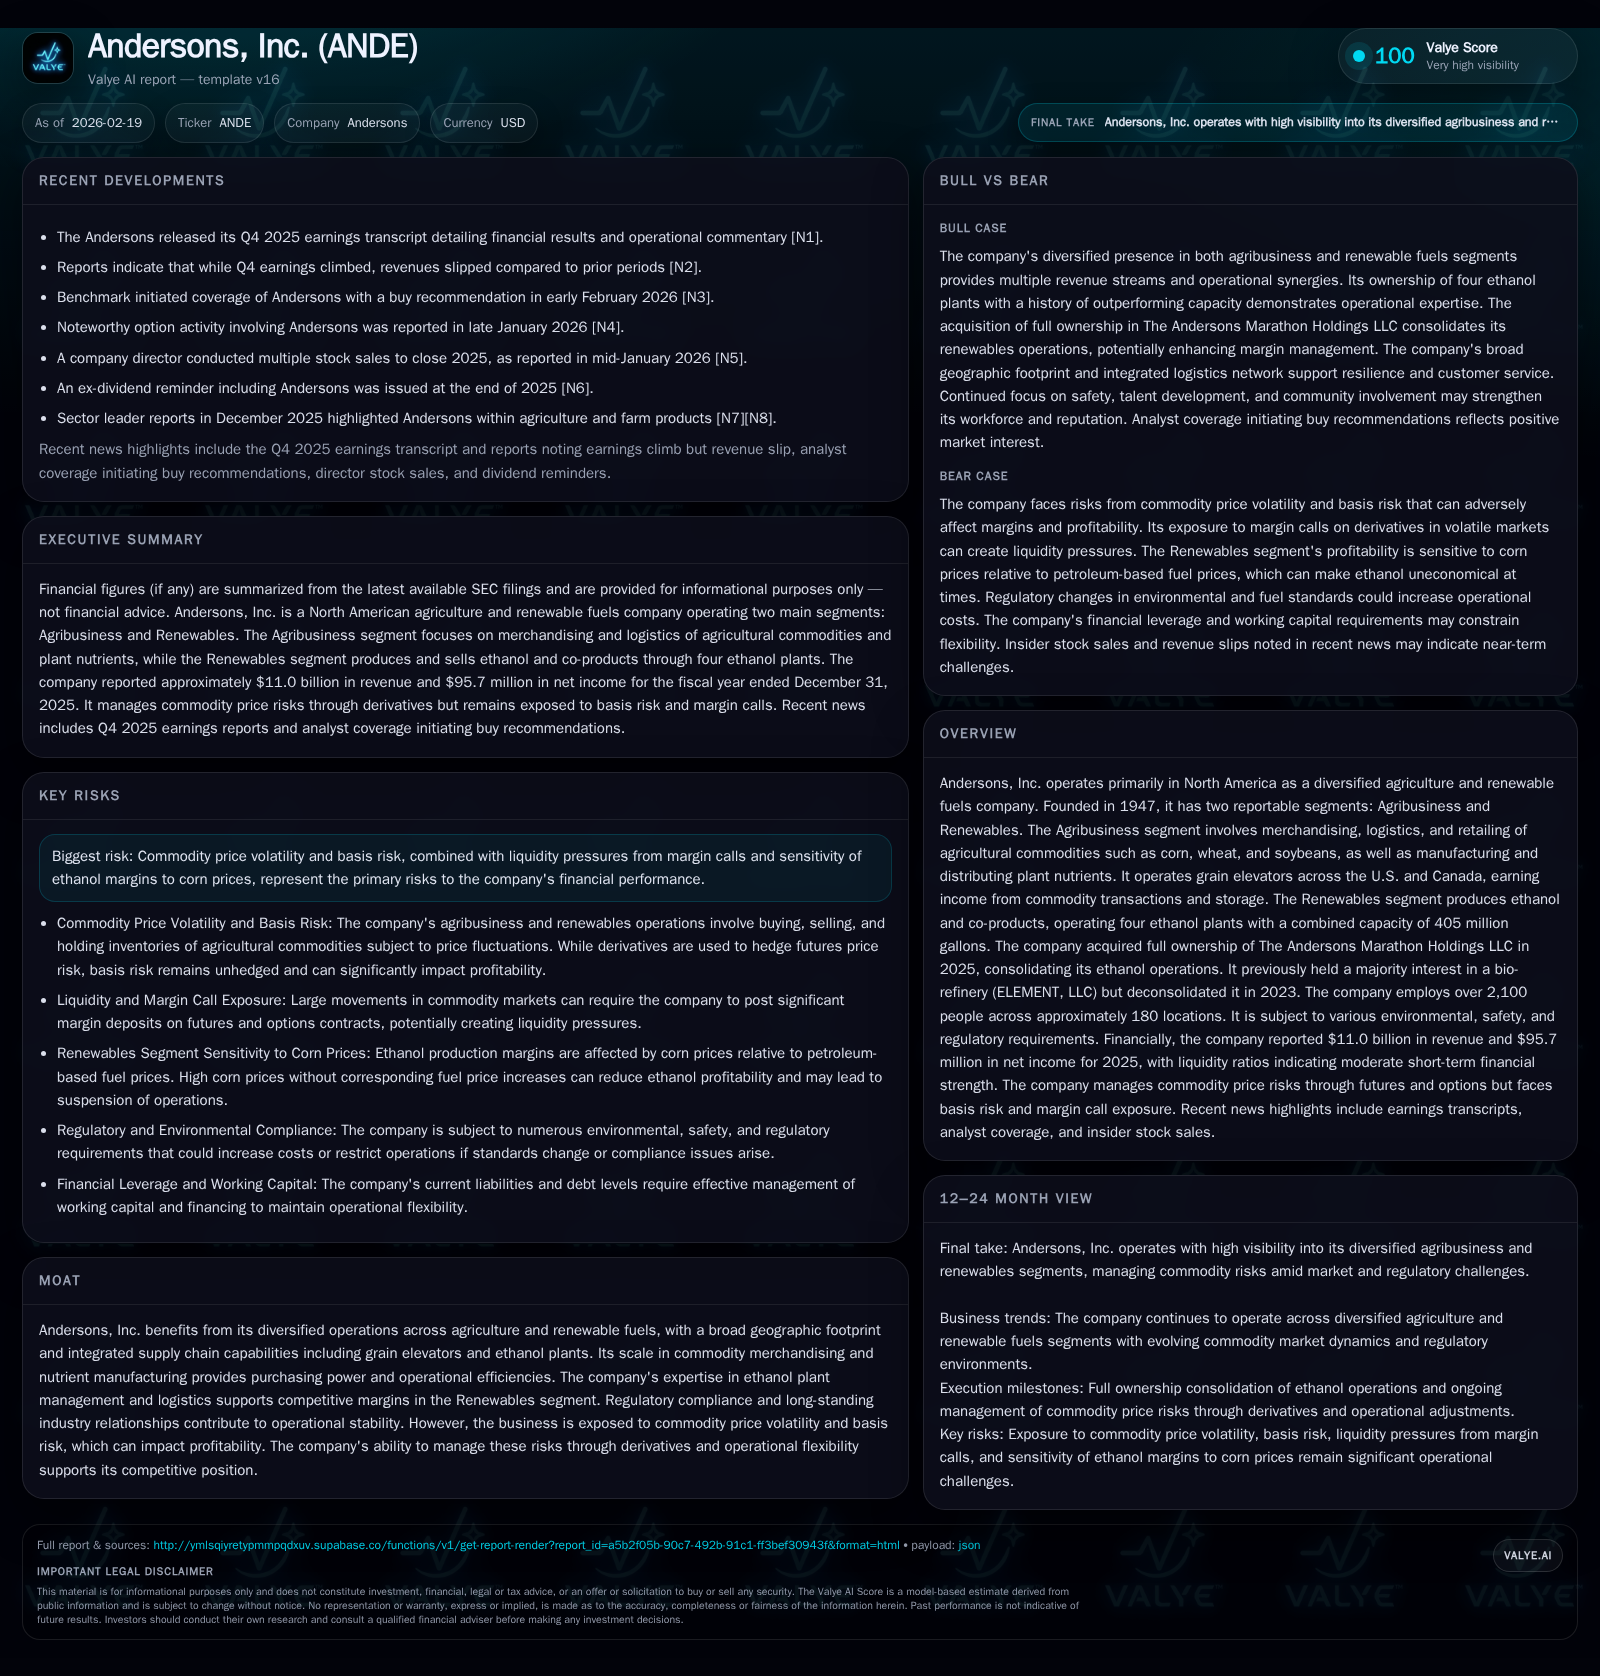
Andersons, Inc. confronted revenue contraction and margin pressures in 2025 following the consolidation of its ethanol operations. While the firm's diversified agribusiness and renewables segments provide strategic advantages, volatile corn prices and basis risk challenged profitability. Increased capital expenditures aimed at supporting ethanol plant capacity contrast with declining operating cash flow, posing liquidity considerations. Shareholder returns remain steady but cautious amid these headwinds, with future performance hinges on commodity market dynamics and regulatory developments.
Historical Revenue Trends: From Growth to Recent Contraction
From a peak revenue of approximately $17.33 billion in FY2022, Andersons experienced a marked contraction over the subsequent three years to $11.01 billion in FY2025 representing a -2.2% drop from FY2024's $11.26 billion [F1]. This decline has been accompanied by a steeper net income falloff of -16.1%, from $114 million in FY2024 to just under $96 million last year [F1]. Operating cash flow followed this downward trajectory even more sharply, plunging nearly half (-46.6%) to $177 million as inventory mark-to-market pressures and earnings softness manifested [F1]. Contrastingly, capital expenditures swelled by over half (56.3%), signaling aggressive reinvestment focused largely on the renewables segment's operational assets [F1]. This combination resulted in negative free cash flow of approximately $56 million.
Historical performance (annual)
| FY | Rev ($bn) | Net ($mm) | CFO ($mm) | Capex ($mm) | Rev YoY | Net YoY |
|---|---|---|---|---|---|---|
| 2025 | 11.0 | 96 | 177 | 233 | -2.2% | -16.1% |
| 2024 | 11.3 | 114 | 332 | 149 | -23.7% | +12.7% |
| 2023 | 14.8 | 101 | 947 | 150 | -14.9% | -22.8% |
| 2022 | 17.3 | 131 | 287 | 108 |
Note: Omitted columns lack sufficient annual XBRL coverage in the provided tags (need ≥2 annual points): OpInc. Source: SEC companyfacts cache [F1].
Capital returns and efficiency (annual)
| FY | Div ($mm) | Buybacks ($mm) | FCF ($mm) |
|---|---|---|---|
| 2025 | 27 | 15 | -56 |
| 2024 | 26 | 2 | 182 |
| 2023 | 25 | 2 | 796 |
| 2022 | 25 | 13 | 179 |
Source: SEC companyfacts cache [F1].
Note: Operating Income data insufficient for table inclusion; latest net income and cash flow available through FY2025 per [F1].
This pattern reflects how external commodity cycles and segment-specific challenges increasingly weighed on Andersons' financial momentum.
Commodity Price Dynamics: Impact on Agribusiness and Renewables
Andersons sits exposed to agricultural commodity price fluctuations prominently impacting both its agribusiness merchandising and ethanol production activities [S1], [S11], [S12]. Corn serves as a pivotal raw material for ethanol; thus, fluctuations in corn pricing—especially basis spreads—create direct margin variability sensitive to petroleum-based fuel prices which set ethanol's market value floor [S1]. The presence of basis risk—the divergence between futures contract prices versus local cash prices inherent in grain inventory valuation—is a perennial challenge that derivatives based on futures/options contracts only imperfectly hedge owing to mismatched timing and geographic differentials [S1], [S20]. Margin calls triggered by wild commodity price swings impose liquidity demands further constraining operating flexibility.
Inventory held at the grain elevators is valued at locally adjusted basis levels relative to futures prices on regulated exchanges [S7], incorporating elevation margins earned via storage fees alongside realized basis appreciation or depreciation [S7], [S17]. The company must negotiate hedges balancing futures contracts against exposure to localized basis moves which can amplify profit impacts when adverse.
Regulatory frameworks such as Renewable Fuel Standards (RFS) administered by the EPA introduce policy-driven uncertainties affecting ethanol demand volumes that compound pricing risks for Andersons' Renewables segment [S20], [S25]. Trade tensions or tariffs impacting import/export flows curtail global grain availability or inflate input costs presenting additional margin headwinds [S11], [S20]. Thus, Andersons operates amid complex interplay between physical commodity markets, financial instruments for risk mitigation, and government policy influences.
Operational Shifts: The 2025 Ethanol Segment Consolidation
In July 2025, Andersons secured full ownership of The Andersons Marathon Holdings LLC (renamed The Andersons Renewables LLC), consolidating control over four ethanol plants located across Iowa, Indiana, Michigan, and Ohio totaling a combined capacity of 405 million gallons annually—although historical operations frequently exceed nameplate outputs , [N1], [S6], [S7]. This vertical integration aims to streamline operational coordination, realize synergies in logistics and procurement, and assert tighter margin management control.
Conversely, Andersons exited majority control of ELEMENT LLC—a Kansas-based bio-refinery with a 70 million gallon capacity—in April 2023 amidst shifting portfolio priorities leading to deconsolidation and eventual asset sales completed by early 2024 , [S6]. This pivot signals an emphasis on optimizing core ethanol assets rather than peripheral bio-refineries.
The consolidation carries operational integration complexities including blending merchandising portfolios across plants and harmonizing supply chains for corn inputs along with co-product marketing strategies such as distillers grains distribution where scale can enhance bargaining positions yet also increase exposure to localized disruptions.
Margin Pressures and Basis Risk Management Techniques
To counter basis risk—the divergence between local cash grain prices and broader exchange-traded futures—Andersons employs derivative instruments including futures contracts, options strategies, and limited over-the-counter deals designed to hedge commodity inventory price risks entering through both Agribusiness merchandising positions as well as Renewables raw material purchases [S1]. However, these derivatives imperfectly correlate with actual inventories due to differences in timing (forward contracting versus immediate inventory), location-specific supply-demand imbalances influencing basis spreads, and product-form variances.
This mismatch necessitates active management resulting in frequent margin calls requiring upfront collateral postings that constrain liquidity particularly during high volatility episodes when commodity prices trend unfavorably forcing abrupt settlement payments [S1]. Moreover, fluctuating basis components can significantly impact profitability beyond what headline futures hedges capture highlighting an intrinsic limit to derivative risk offsetting capabilities within agricultural commodity operations.
The company continuously monitors its derivative exposure relative to physical positions aiming to calibrate hedge ratios dynamically but remains subject to unforeseen market shocks that may impair hedge effectiveness or trigger liquidity stress events leading to operational disruptions if not timely addressed.
Capital Spending Surge: Investment Rationales and Implications
The substantial increase (56.3%) in capital expenditures reaching approximately $233 million in FY2025 contrasts against subdued operating cash flow underscoring notable reinvestment drive within both segments but predominantly linked to the Renewables division’s ethanol plant enhancements and nutrient manufacturing upgrades [F1], [S1].
Such capital intensity reflects strategic commitments toward boosting throughput efficiency at existing ethanol facilities potentially elevating output beyond nameplate capacity margins described earlier while ensuring compliance with evolving environmental regulations which may mandate facility upgrades related to emissions controls or wastewater management systems [S11], [S16].
Simultaneously, updates in plant nutrient production lines aim at maintaining competitive product quality amidst supplier concentration risks that affect input supply cost structures within Agribusiness nutrient manufacturing operations where purchasing power governs price competitiveness critically impacting margins given commoditized product profiles [S6], [S15].
This capex surge amplifies depreciation charges going forward while exerting pressure on free cash flow generation needing vigilant monitoring especially if operating income remains constrained by external price sensitivities.
Liquidity Status and Risk Exposure from Commodity Derivatives
With current assets around $2.38 billion against current liabilities near $1.69 billion at FY-end 2025, Andersons holds a current ratio approximating healthy liquidity at 1.41—indicating reasonable short-term solvency cushions despite challenging operating conditions coupled with margin call obligations from derivative activities that periodically escalate collateral requirements during market upheavals [F1], [S18], [S23], [S27], [N2].
The degree of derivative liabilities exposes the company to sudden liquidity drawdowns tied directly to commodity price shifts outside management control necessitating ample access to revolving credit facilities or liquid reserves ensuring margin calls can be met without jeopardizing operational continuity or summoning expensive emergency financing.[S1] documents indicate awareness of these vulnerabilities highlighting risk mitigation efforts yet underscore sensitivity during rapid price movement phases requiring continuous funding readiness.
Shareholder Returns: Dividends, Buybacks, and Capital Allocation Highlights
Despite cash flow headwinds stemming from earnings pressure and increased capex outflows resulting in negative free cash flow estimated near $56 million in FY2025, Andersons maintains disciplined capital allocation policies focused on steady dividend growth complemented by measured share repurchases enhancing shareholder value retention.[F1],[N3]
Dividend payouts increased modestly from $26 million in FY2024 to just under $27 million last year signaling commitment towards returning income even amid profit compression while buyback expenditures rose more sharply from approximately $2.3 million up to $15.4 million reflecting opportunistic repurchasing probably aligned with stock price levels viewed as undervalued.[F1]
Using reported equity approximations near $1.24 billion yields an implied return on equity near 7.7%, a moderate figure reflecting current margin pressures but also base-level profitability supporting ongoing distributions.[F1]
What to Watch: Indicators for Recovery or Further Compression
Forward performance pivots critically on several macro-micro factors:
- Corn pricing relative to petroleum fuel benchmarks will dictate renewables segment margin viability since elevated corn basis without commensurate fuel price rises erodes cost-competitiveness forcing potential production curtailments.[N1],[N2],[S1]
- Ethanol demand trends shaped by evolving Renewable Fuel Standards policy adjustments alongside broader biofuel market penetration influences volume stability assumptions impacting throughput planning.[N1],[S20]
- Regulatory changes possibly imposing stricter environmental compliance costs could recalibrate capex needs influencing cash flow dynamics going forward.[S11],[S25]
- Commodity derivatives markets’ volatility patterns will signal liquidity risk levels especially frequency/severity of margin calls correlated with inventory positioning practices.[S1],[N2]
- Operational integration success metrics from complete ownership of Marathon Holdings LLC plants including achievement of targeted capacity outperformance vs nameplate volumes indicating efficiency gains vs transitional frictions.[N1],[S6]
- Competitive landscape shifts among large agribusiness peers with greater scale/integration could pressure pricing power across both segments.[S9] Monitoring quarterly results releases alongside commodity market signals will therefore be essential for gauging whether Andersons reverses recent profit declines or experiences intensified compression of returns given inherent volatility inherent within its business model.
This analysis synthesizes publicly available financial disclosures including SEC filings (notably Form 10-K/10-Q), recent news transcripts covering earnings commentary along with detailed company fact sets soliciting domain-specific examination tailored for internal Valye News readership without conveying investment recommendations or opinions.
Disclaimer: This is research-only, informational analysis and not investment advice. It may include AI-generated interpretation and general industry context. Always verify important details using primary sources.
Comments