
American States Water Balances Regulatory Challenges with Contract Growth and Infrastructure Investment
AWR's regulated utilities in California and U.S. military base contracts drive steady expansion amid evolving regulatory and climate risks.
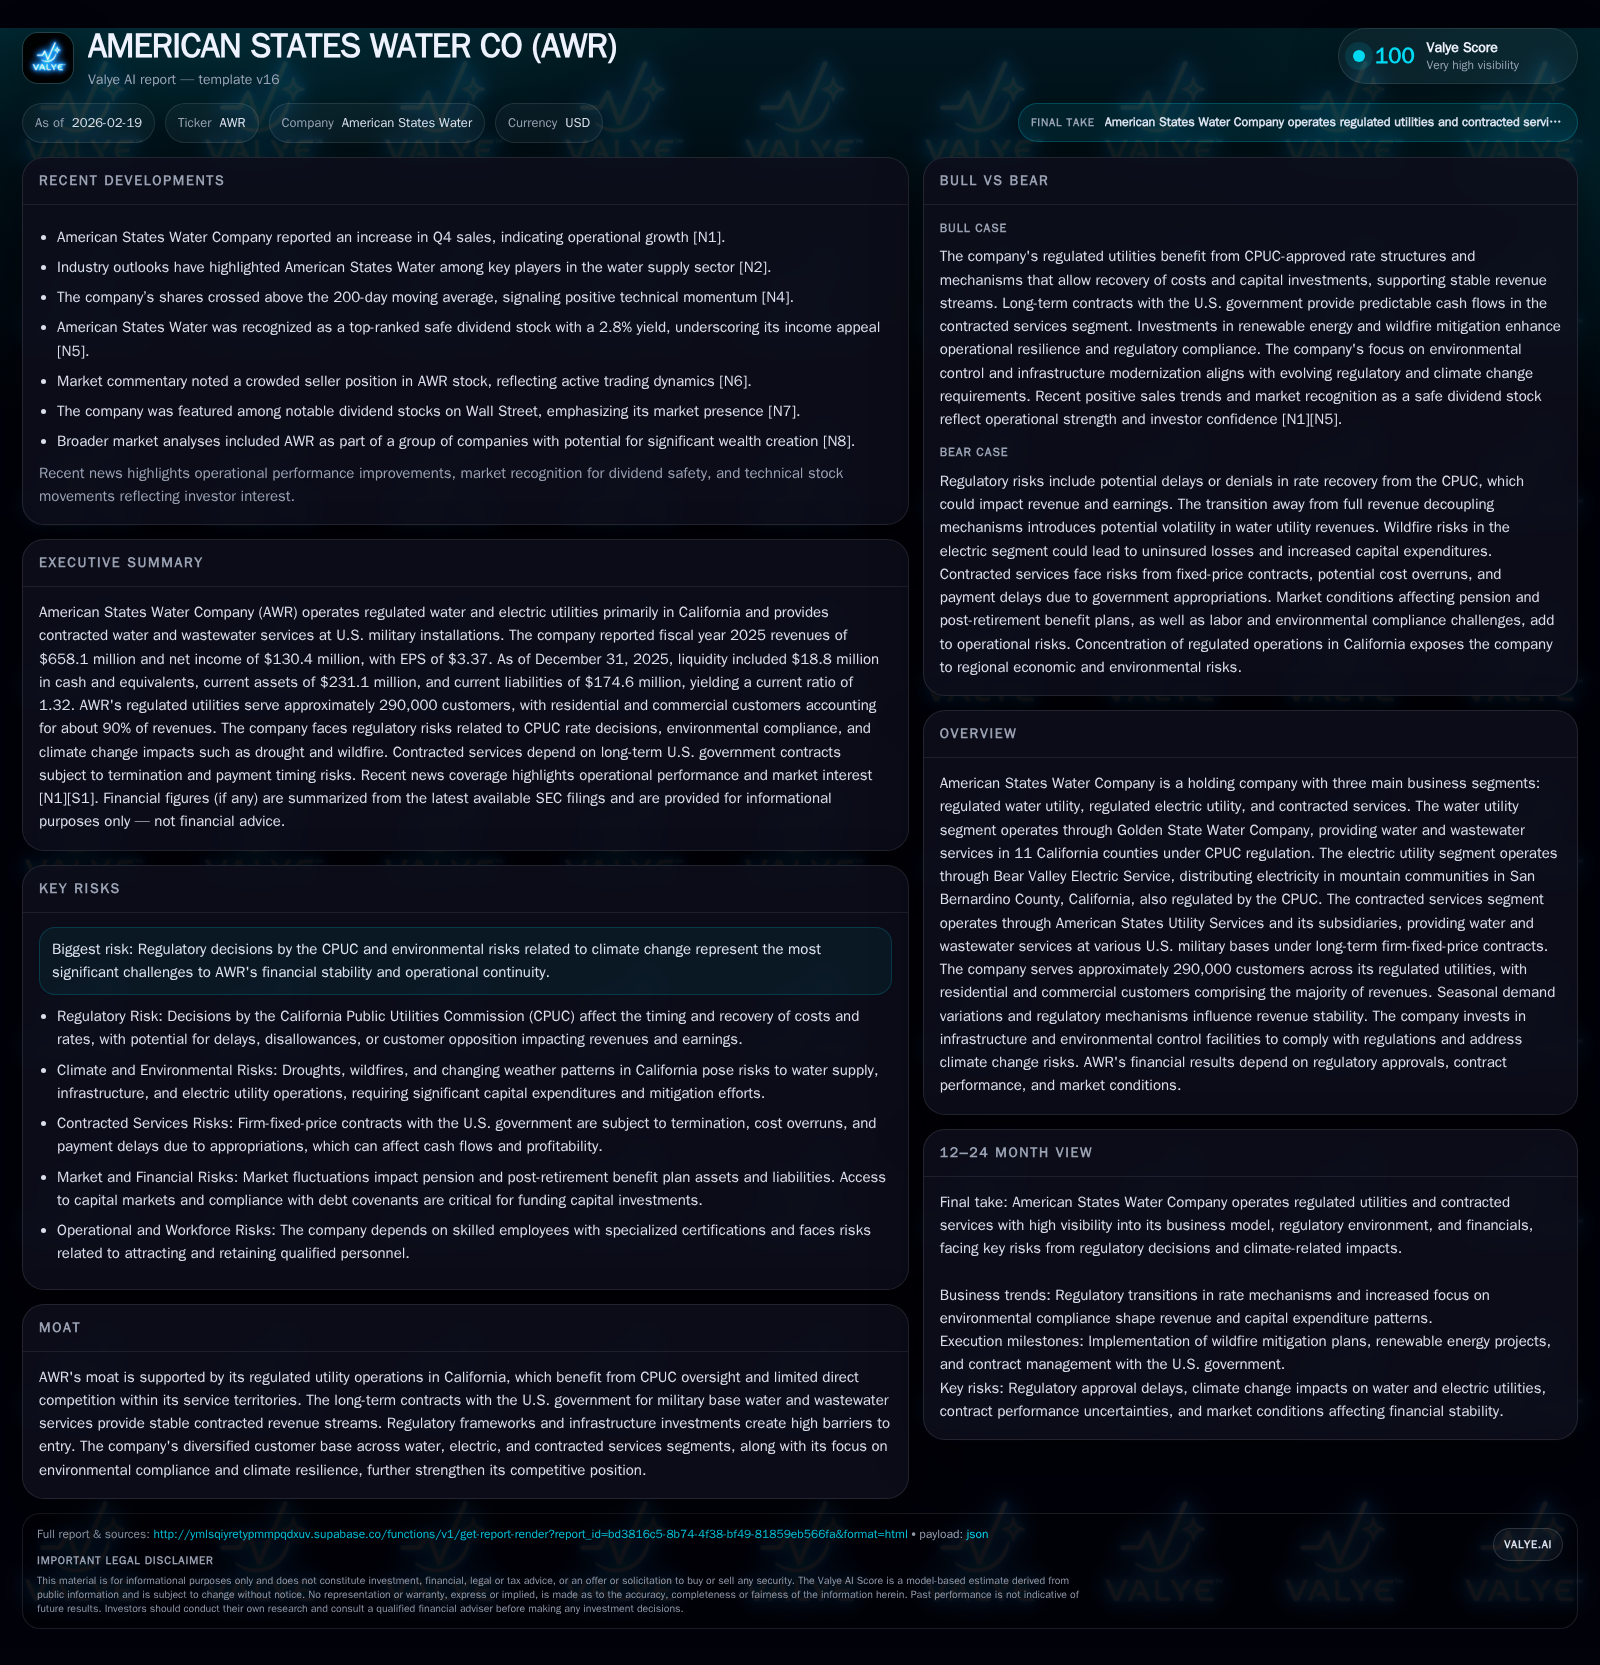
American States Water Company (AWR) operates regulated water and electric utilities within California alongside a growing portfolio of long-term, firm-fixed-price contracts servicing U.S. military installations. Over the past four years, AWR demonstrated consistent revenue and income growth driven by rate cases, expanding customer bases, and contract extensions. However, changes in regulatory mechanisms, notably the transition from full revenue decoupling to a modified rate adjustment system by the CPUC, introduce revenue volatility risk tied to fluctuating customer consumption. Capital expenditures remain elevated to address aging infrastructure, wildfire mitigation, and environmental compliance. Contracted services offer steady revenues backed by government agreements but face competitive pressures and potential government funding uncertainties. The company maintains healthy cash flows but experienced near breakeven free cash flow in 2025 due to high capex. Investors should monitor future regulatory decisions and contract renewals as key growth determinants.
Company Overview
American States Water Company (AWR) is a holding company overseeing three principal operating segments: its regulated water utility via Golden State Water Company (GSWC), regulated electric utility Bear Valley Electric Service (BVES), and contracted services operated through American States Utility Services (ASUS). GSWC serves 11 counties in California providing water purchase, production, distribution, and wastewater services under strict CPUC regulation. BVES distributes electricity within select San Bernardino County mountain communities, also CPUC-regulated. ASUS operates under long-term firm-fixed-price contracts delivering water/wastewater services at various U.S. military bases nationwide.
As of December 31, 2025, AWR served approximately 290,000 customers combined across its regulated utilities—265,142 water customers and 24,915 electric customers—with residential/commercial users accounting for roughly 90% of related revenues [S4][S9].
Historical Financial Performance
AWR has exhibited steady top-line and profitability expansion over recent years driven primarily by regulated rate cases granting periodic price escalations, incremental customer additions amid moderate population growth in California service areas, contract renewals with U.S. military installations, and operational enhancements.
Historical performance (annual)
| FY | Rev ($mm) | Net ($mm) | CFO ($mm) | OpInc ($mm) | Rev YoY | Net YoY |
|---|---|---|---|---|---|---|
| 2025 | 658 | 130 | 230 | 203 | +10.5% | +9.4% |
| 2024 | 595 | 119 | 199 | 184 | -0.0% | -4.5% |
| 2023 | 596 | 125 | 68 | 197 | +21.2% | +59.3% |
| 2022 | 492 | 78 | 118 | 127 |
Note: Omitted columns lack sufficient annual XBRL coverage in the provided tags (need ≥2 annual points): Capex, Buybacks. Source: SEC companyfacts cache [F1].
Capital returns and efficiency (annual)
| FY | Div ($mm) | FCF ($mm) | ROE% |
|---|---|---|---|
| 2025 | 75 | -7 | 12.5 |
| 2024 | 67 | -33 | 13.0 |
| 2023 | 61 | -121 | 16.1 |
| 2022 | 56 | -48 | 11.0 |
Source: SEC companyfacts cache [F1].
Note: Buyback data omitted due to insufficient recent activity; last buybacks recorded pre-2017.
Operating income tracks closely with revenue trends reflecting effective expense management despite inflationary pressures on supply and personnel costs [F1]. Operating cash flow growth notably outpaced net income growth in FY2024-25 owing partly to improved working capital management and operational efficiencies [F1]. Capital expenditures have trended upwards over these periods driven by infrastructure replacement needs – especially critical amid heightened wildfire mitigation requirements for BVES – as well as ongoing environmental compliance investments [S17].
Dividends were raised consistently each year parallel to earnings growth supporting a dividend yield near the reported ~2.8%, underscoring AWR's conservative capital allocation approach focused on sustaining payout while reinvesting heavily into the business [N5][F1]. No share repurchases have occurred since before FY2017 reflecting perhaps a preference for balance sheet fortification over market-based capital return.
Business Segment Analysis & Growth Drivers
Regulated Water Utility (GSWC)
GSWC accounts for the bulk of AWR's revenue base through its CPUC-regulated operations across diverse Southern California counties [S4]. Historically benefiting from decoupled revenue mechanisms such as the WRAM (Water Revenue Adjustment Mechanism) that stabilized income despite fluctuations in volumetric water sales due to conservation efforts or climatic variability [S9], GSWC faced a significant regulatory shift in early-2025 when CPUC ruled against continuation of full WRAM mechanisms post-general rate case filings [S9][S11]. Instead, GSWC must now operate under a modified WRAM (M-WRAM) combined with an incremental cost balancing account focused primarily on supply costs.
This shift increases exposure to revenue volatility linked directly to customer consumption patterns—a notable risk given California's aggressive water conservation mandates intensified by recurrent drought cycles attributed to climate change [S7][S25]. While GSWC remains authorized to use a sales reconciliation mechanism allowing some forecast adjustment mid-cycle, without a full decoupling safeguard GSWC faces higher earnings variability going forward.
Capital expenditure emphasis continues on upgrading aging treatment plants, enhancing water quality compliance measures including handling emerging contaminants like PFAS—settlements related to these contaminants generating limited recovery funds—and increasing supply resilience amidst resource constraints [S10][S25][S8]. Infrastructure modernization includes digital metering deployments supporting operational efficiency amid changing demand dynamics.
Population growth within service zones offers organic expansion potential but remains tempered by macroeconomic conditions and evolving customer water use behaviors favoring efficiency.
Regulated Electric Utility (BVES)
BVES provides electricity in mountainous San Bernardino County localities typified by seasonal demand swings highly correlated with snow levels affecting ski resort operations that constitute substantive load drivers [S9][S15]. In response to heightened wildfire-risk concerns catalyzed by climatic shifts producing drier vegetation conditions posing systemic fire hazards across California utilities generally [S11], BVES undertakes comprehensive wildfire mitigation planning strategies mandated by the Office of Energy Infrastructure Safety and cpu c oversight including capital-intensive infrastructure hardening projects slated between now and at least late-2020s [S11].
While initial capital outlays for wildfire mitigation are substantial—with cost recovery dependent on regulatory ratification primarily through upcoming general rate case proceedings—these investments are crucial for maintaining service continuity and minimizing inverse condemnation liabilities that could otherwise materially affect financial performance [S11][S12].
Renewable integration initiatives encompass limited customer-owned solar generation interconnected via net energy metering programs contributing around seven percent of total electricity consumed within BVES's footprint [S15], reflecting modest but growing distributed energy resources penetration.
Contracted Services (ASUS)
This segment comprises wholly-owned subsidiaries operating long-dated (50-year) firm-fixed-price contracts plus task order agreements providing essential water/wastewater services at multiple U.S. military bases across states including Texas, Virginia, Maryland, South Carolina, North Carolina, Florida, Kansas and Massachusetts [S4][S5]. The scale—a geographically diversified portfolio with high switching costs—offers contracted recurring revenues insulated from typical market competition albeit exposed to government appropriation risks.
Revenue adjustments align annually through economic price adjustments; however, delays occasionally occur in procurement approvals or equitable adjustment settlements creating short-term cash flow timing challenges [S7][S20]. Competitive bidding intensity for new contracts remains elevated among investor-owned entities contesting municipal operators although ASUS's track record supports renewal prospects [S21].
Capital expenditures within this segment include construction renewals and expansions tailored explicitly to military base requirements subject to contract modifications arising from changing federal regulations or base-specific needs [S21][S20].
Environmental regulations affecting wastewater treatment standards are anticipated to tighten further raising operational costs that may be recoverable through contract pricing escalations if negotiated promptly [S20].
Forecasts & Monitoring Points
No explicit forward guidance is provided beyond regulatory filings; thus key indicators requiring attention include:
- CPUC rulings on pending or upcoming general rate cases for both GSWC and BVES influencing allowed returns on invested capital and cost recovery timelines.
- Efficacy of M-WRAM mechanism adoption at GSWC mitigating revenue swings amid consumption changes.
- Development of wildfire mitigation-related capital investments approval and rate base inclusion at BVES.
- Success rate and timing for securing new or renewal military base contracts under ASUS.
- Impact of evolving environmental regulations particularly PFAS cleanup costs and wastewater treatment standards on operating margins.
- Broader economic variables influencing customer growth rates or consumption patterns such as inflation pressures or housing development trends within service territories.
Capital Allocation & Returns
AWR's ROE hovered near an estimated 12.5% in FY2025 reflecting solid utility returns consistent with regulated industry norms given rate base returns approved by CPUC balanced against elevated spending demands [F1].
Operating cash flows exhibited robust growth rising faster than net income as working capital management improved post-pandemic disruptions; nevertheless large capex commitments yielded slightly negative free cash flow (~$7 million deficit) last fiscal year indicating reinvestment intensity outpacing operational cash generation temporarily [F1].
Dividend distributions increased steadily reaching $74.6 million paid during FY2025 illustrating strong commitment toward shareholder returns amidst capital budget expansion [F1][N5]. No buyback programs have been active recently suggesting a deliberate strategy prioritizing infrastructure funding over equity repurchases.
Liquidity stands adequate with positive current ratios (~1.32x) supported by access to credit facilities facilitating interim capex funding pending regulatory cost recovery approvals [F1][S17][S19]. However exposure exists related to potential delays in CPUC filings which if prolonged can pressure short-term financing needs.
Industry Context & Sector Dynamics Analysis
California utilities face mounting pressures from increasingly stringent environmental regulations mandating upgrades for resilience against wildfires exacerbated by droughts linked to climate change impacting water availability sources as well as demand forecasts subject to enhanced conservation rules enforced statewide . Decoupling mechanisms trend towards more nuanced forms replacing traditional volumetric protections as regulators seek better alignment of usage incentives though at the cost of elevated revenue volatility risks for operators like AWR’s GSWC .
Federal privatization contracts for military bases provide niche stable revenues scarce elsewhere though tied intricately to federal budgetary priorities presenting unique counterparty risk profiles compared with typical municipal contracts seen in broader sector context .
Labor availability constraints remain prominent given skilled workforce needs combined with anticipated retirements challenging recruitment pipelines consistent across public utility providers nationally driving higher compensation and training expenses necessary for operating complex assets safely per evolving standards including cybersecurity obligations .
Risks Summary
- Regulatory: Decisions on rate approvals, transition mechanisms (e.g., M-WRAM), wildfire mitigation cost allowances can materially alter earnings trajectories.[S8][S10][S14]
- Climate/Environment: Drought stress undermines supply reliability; wildfires expose assets; stricter contamination cleanup leads to escalating O&M spend.[S7][S11]
- Contracted Services: Government contract renewals depend on federal budgets; pricing adjustments face negotiation lags; competitive environment intensifies.[S20][S21]
- Operational & Safety: Physical asset protection against disasters/cyber threats critical; cost burdens from safety incidents can impair financials.[S12][S13]
- Human Capital: Workforce attrition risks rising amid retirements; special certifications needed increase hiring/training complexity.[S16][S22]
- Liquidity: Heavy capex coupled with delayed rate case approvals could constrain cash flow flexibility.[S17][S19]
Conclusion
American States Water Company demonstrates commendable durability grounded in its blend of regulated monopoly franchises intrinsic carbon-footprint-conscious utilities serving rapidly growing California markets coupled with long-term contracted government business insulating some cyclicality. Adjusting to evolving public utility commission decisions following decoupling regime shifts marks a pivotal operational inflection point requiring vigilant financial discipline alongside sustained investment pace particularly targeting climate resilience through wildfire mitigations at BVES as well as continual environmental compliance upgrades across its footprint.
Strategic prospects hinge upon ability not only to secure timely regulatory approvals maintaining constructive relations with state commissions but also successfully competing for expanded government privatization contracts while managing external uncertainties stemming from climatic variability and labor market tightness affecting operational continuity.
Disclosures: This analysis is based solely on publicly available information as of February–March 2026 from SEC filings ([F1],[S1]–[S29]) and relevant news reports ([N1]–[N9]). It does not constitute investment advice or recommendations concerning securities or investment strategies concerning American States Water Company or any other entity.
Disclaimer: This is research-only, informational analysis and not investment advice. It may include AI-generated interpretation and general industry context. Always verify important details using primary sources.
Comments