
The Hartford Insurance Group's Premium Growth and Investment Income Drive 2025 Performance Amid Regulatory Constraints
Strong underwriting results and disciplined capital management underpin The Hartford’s financial momentum in 2025.
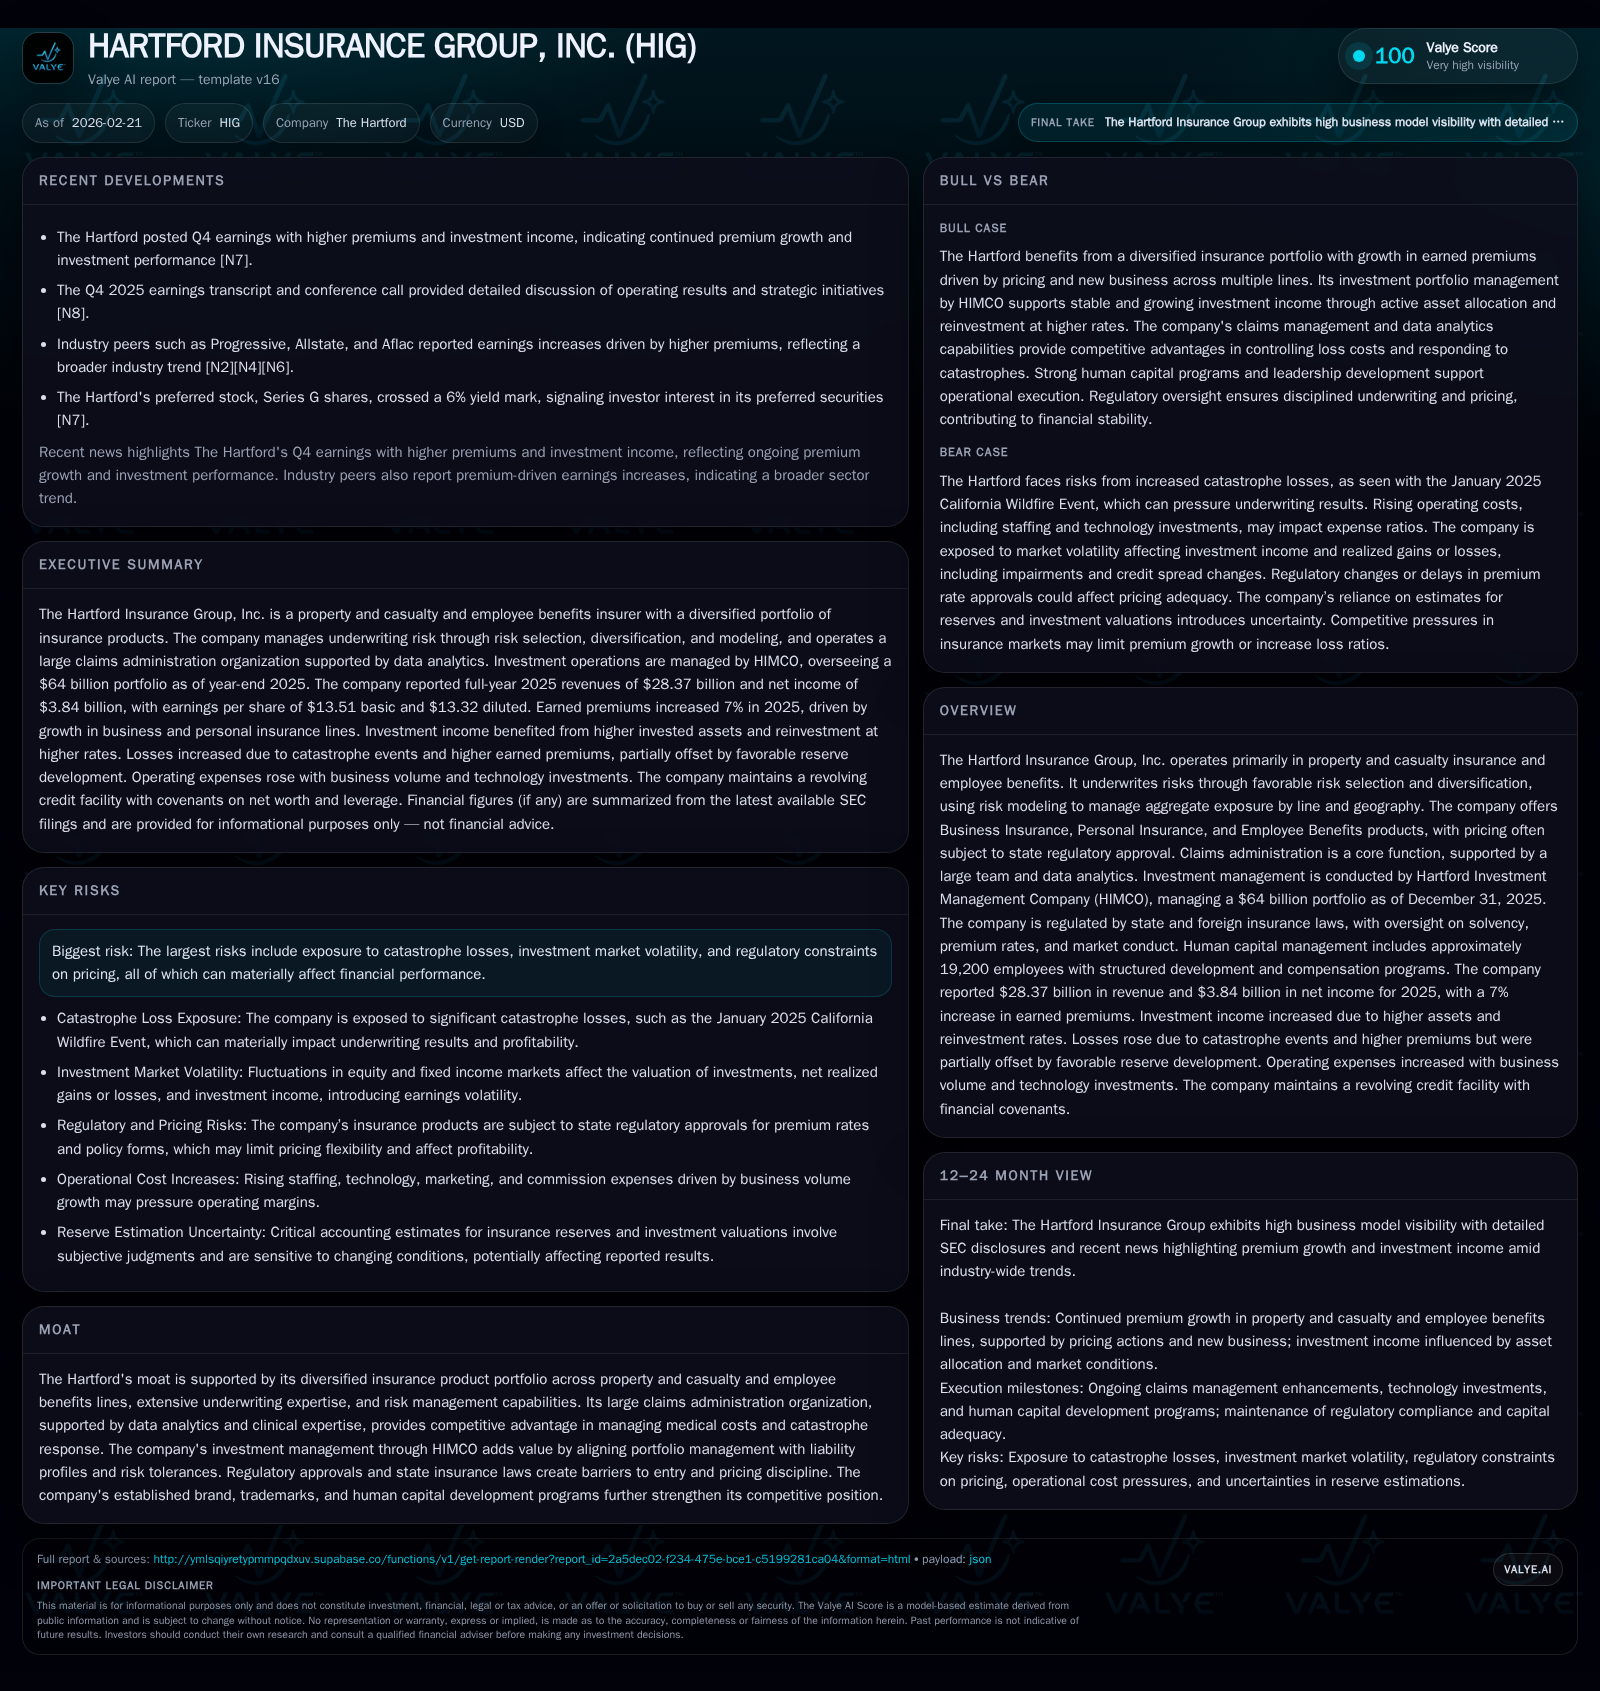
In 2025, The Hartford Insurance Group posted robust growth in earned premiums, particularly from its Business and Personal Insurance lines, alongside increased net investment income driven by higher invested assets and reinvestment at elevated interest rates. The company’s disciplined underwriting, characterized by effective risk selection and prior-year reserve development, contributed positively despite elevated catastrophe losses. Capital allocation remained shareholder-friendly with steady dividends and growing share repurchases. Regulatory dynamics and catastrophe exposure remain key risks that could influence future profitability and pricing power.
Company Overview
The Hartford Insurance Group operates primarily in Property & Casualty (P&C) insurance and Employee Benefits sectors. It emphasizes favorable risk selection backed by diversified product offerings including Business Insurance, Personal Insurance, and Employee Benefits products. Pricing is tightly regulated with premium rates often requiring state approval. Supported by approximately 19,200 employees, the company's claims administration leverages extensive staff expertise alongside advanced data analytics to manage claim costs efficiently [S1]. Investment management is conducted through the Hartford Investment Management Company (HIMCO), overseeing a portfolio valued at about $64 billion as of December 31, 2025 [S1].
Historical Growth and Performance
The Hartford demonstrated consistent revenue growth over recent years: revenues rose from $22.36 billion in 2022 to $28.37 billion in 2025 — an annualized growth rate of approximately 6.9%. Net income displayed a substantial uplift, with $3.84 billion reported for 2025 versus $1.82 billion in 2022 [F1]. Operating cash flows similarly expanded from around $4.0 billion to over $5.9 billion within this period.
Historical performance (annual)
| FY | Rev ($bn) | Net ($bn) | CFO ($bn) | Capex ($mm) | Rev YoY | Net YoY |
|---|---|---|---|---|---|---|
| 2025 | 28.4 | 3.8 | 5.9 | 169 | +6.9% | +23.3% |
| 2024 | 26.5 | 3.1 | 5.9 | 145 | +314.6% | +303.5% |
| 2023 | 6.4 | 0.8 | 4.2 | 215 | -71.4% | -57.5% |
| 2022 | 22.4 | 1.8 | 4.0 | 175 |
Note: Omitted columns lack sufficient annual XBRL coverage in the provided tags (need ≥2 annual points): OpInc. Source: SEC companyfacts cache [F1].
Capital returns and efficiency (annual)
| FY | Div ($mm) | Buybacks ($mm) | FCF ($bn) |
|---|---|---|---|
| 2025 | 592 | 1615 | 5.8 |
| 2024 | 556 | 1514 | 5.8 |
| 2023 | 528 | 1400 | 4.0 |
| 2022 | 506 | 1550 | 3.8 |
Source: SEC companyfacts cache [F1].
*Note: The substantially lower revenue figure for FY2023 likely reflects accounting reclassifications or divestitures rather than operational decline [F1].
Operating income data for recent years is not fully available from provided tags but historical figures indicate positive operating results [F1]. The company maintains strong operating cash flow relative to net income, reflecting solid cash earnings quality.
Segment Performance Drivers
Property & Casualty (P&C)
The P&C segment experienced a premium increase of approximately 9% driven by new business growth across most lines as well as earned pricing increases [S1][S15]. Losses and loss adjustment expenses increased moderately but were cushioned by favorable prior accident year reserve development totaling hundreds of millions before tax [S1][S15]. Catastrophe-related losses rose due to events such as the January California wildfire (net losses around $305 million after reinsurance), alongside tornadoes and hail concentrated mainly across South and Midwest regions [S24]. These natural catastrophes contribute significantly to volatility in underwriting results.
Personal Insurance
This sub-segment also posted about a similar premium increase (+9%), benefiting from rate actions despite some policy count declines due to tighter underwriting standards limiting renewals [S1][S15]. Loss ratios were generally stable or improved modestly through effective claims management.
Employee Benefits
This segment showed slight premium growth (~1%), primarily from increased exposure on existing accounts rather than new sales [S15]. Elevated loss ratios in long-term disability partially offset improvements in group life mortality and better pricing on paid family medical leave products [S24]. Expense ratios increased somewhat due to higher staffing levels and technology investments.
Investment Portfolio Performance
HIMCO manages a diverse fixed-income-heavy portfolio valued at approximately $62.6 billion as of September 30, 2025, comprising primarily fixed maturities (72%), mortgage loans (10%), limited partnerships/alternative investments (9%), equities (1%), short-term investments (~7%) plus other smaller categories [S18][S9].
Net investment income grew due to reinvestment at higher yields (average reinvestment rates around ~5.7%) and appreciation in limited partnerships while yields on variable-rate securities declined slightly [S16][S11]. Total net investment income for the nine months ended September was approximately $2.08 billion before tax versus about $1.85 billion for the prior year period [S16]. However, net realized losses expanded amidst market volatility impacting equities, credit spreads on fixed maturities under fair value option securities, foreign currency transactional effects, and impairment charges on real estate investments [S16][S7].
Regulatory Environment and Risks
The Hartford operates under extensive state-level insurance regulations governing licensing, capital adequacy, premium rate filings, underwriting practices, corporate transactions, and dividend restrictions [S1][S19]. These frameworks prioritize policyholder protection over insurer profit maximization which constrains pricing flexibility especially in competitive lines like Personal Insurance.
Emerging areas such as climate change regulation impose additional compliance burdens with diverse requirements across U.S states plus international jurisdictions where the company operates via subsidiaries or Lloyd's Syndicate arrangements [S1][S19]. Climate-related disclosure mandates may elevate operating expenses while introducing litigation risk.
Investment market volatility poses ongoing risk given its impact on net investment income realizations and asset valuations which indirectly influence underwriting capacity via capital availability.
Catastrophe events remain significant uncertainty requiring calibrated balance between pricing adequacy and market competitiveness [S1][S24].
Capital Allocation and Financial Strength
The Hartford allocates capital prudently balancing operational reinvestment needs with shareholder return strategies:
- Dividends paid increased modestly from $556 million in FY24 to $592 million in FY25.
- Share repurchases grew slightly from approximately $1.51 billion to $1.62 billion over the same period indicating sustained commitment to shareholder value distribution [F1][S18].
- Capital expenditures rose modestly (+~16%) supporting technology upgrades and staff expansion aimed at improving underwriting accuracy and claims processing efficiency.
- Equity capital base expanded steadily reaching nearly $19 billion at December-end FY25 underpinning strong capitalization buffer against claim volatility.
- Return on equity (ROE) approximates an attractive ~20%, reflecting effective leverage of equity into profits based on latest annual net income relative to equity base [F1].
- Free cash flow (operating cash flow minus capex) remains robust above $5.75 billion annually providing ample funding flexibility for dividends/buybacks or opportunistic acquisitions.
- Liquidity is conservatively managed with revolving credit facilities capped at several hundred million dollars featuring covenants ensuring prudent leverage metrics consistent with investment-grade ratings preservation [S4][S14].
Outlook Considerations (Analysis)
While no explicit forward guidance is provided beyond disclosures within SEC filings/earnings calls, key items to monitor include:
- Pricing environment regulatory approvals will impact margin sustainability amid inflationary cost pressures.
- Frequency/severity of catastrophe losses remain volatile variables influencing annual underwriting outcomes.
- Investment portfolio yield trends amid fluctuating interest rates could materially affect net investment income contributions.
- Employee benefits claims experience for long-term disability requires close monitoring given recent upward trend.
- Evolving regulatory frameworks around climate risk disclosure may incrementally increase operational costs.
- Prior accident year reserve development demonstrates prudent reserving; however adverse movements could pressure earnings.
- Capital deployment dynamics might shift depending on corporate strategy changes or macroeconomic shocks; current trajectory emphasizes balanced returns with continued buybacks/dividends.
Industry Context (Analysis)
The P&C insurance industry faces headwinds from increasing frequency/severity of natural catastrophes linked partly to climate change alongside inflation-driven claim cost escalation pressures. Regulatory scrutiny has intensified leading insurers toward cautious rate filings balancing affordability concerns against profitability needs.
Investment portfolios are challenged by persistent interest rate volatility impacting both fixed income returns as well as equity market valuations necessitating dynamic asset-liability management common among large insurers like The Hartford.
Technological investments increasingly focus on improved underwriting through AI-enabled analytics plus streamlined claims workflows leveraging telematics data — areas where The Hartford's recent staffing/technology investments are relevant signals [S12][F1].
Disclaimer: This analysis is based solely on publicly available information including SEC filings ([S#]), news articles ([N#]), and companyfacts data ([F1]). It is intended for informational purposes without any recommendation regarding buying or selling securities issued by The Hartford Insurance Group or any related entities.
Disclaimer: This is research-only, informational analysis and not investment advice. It may include AI-generated interpretation and general industry context. Always verify important details using primary sources.
Comments