
ProAssurance’s Shift in Specialty Insurance Performance and Capital Strategy
Specialty underwriting changes and capital deployment amid loss projections shape ProAssurance’s 2025 results and near-term outlook.
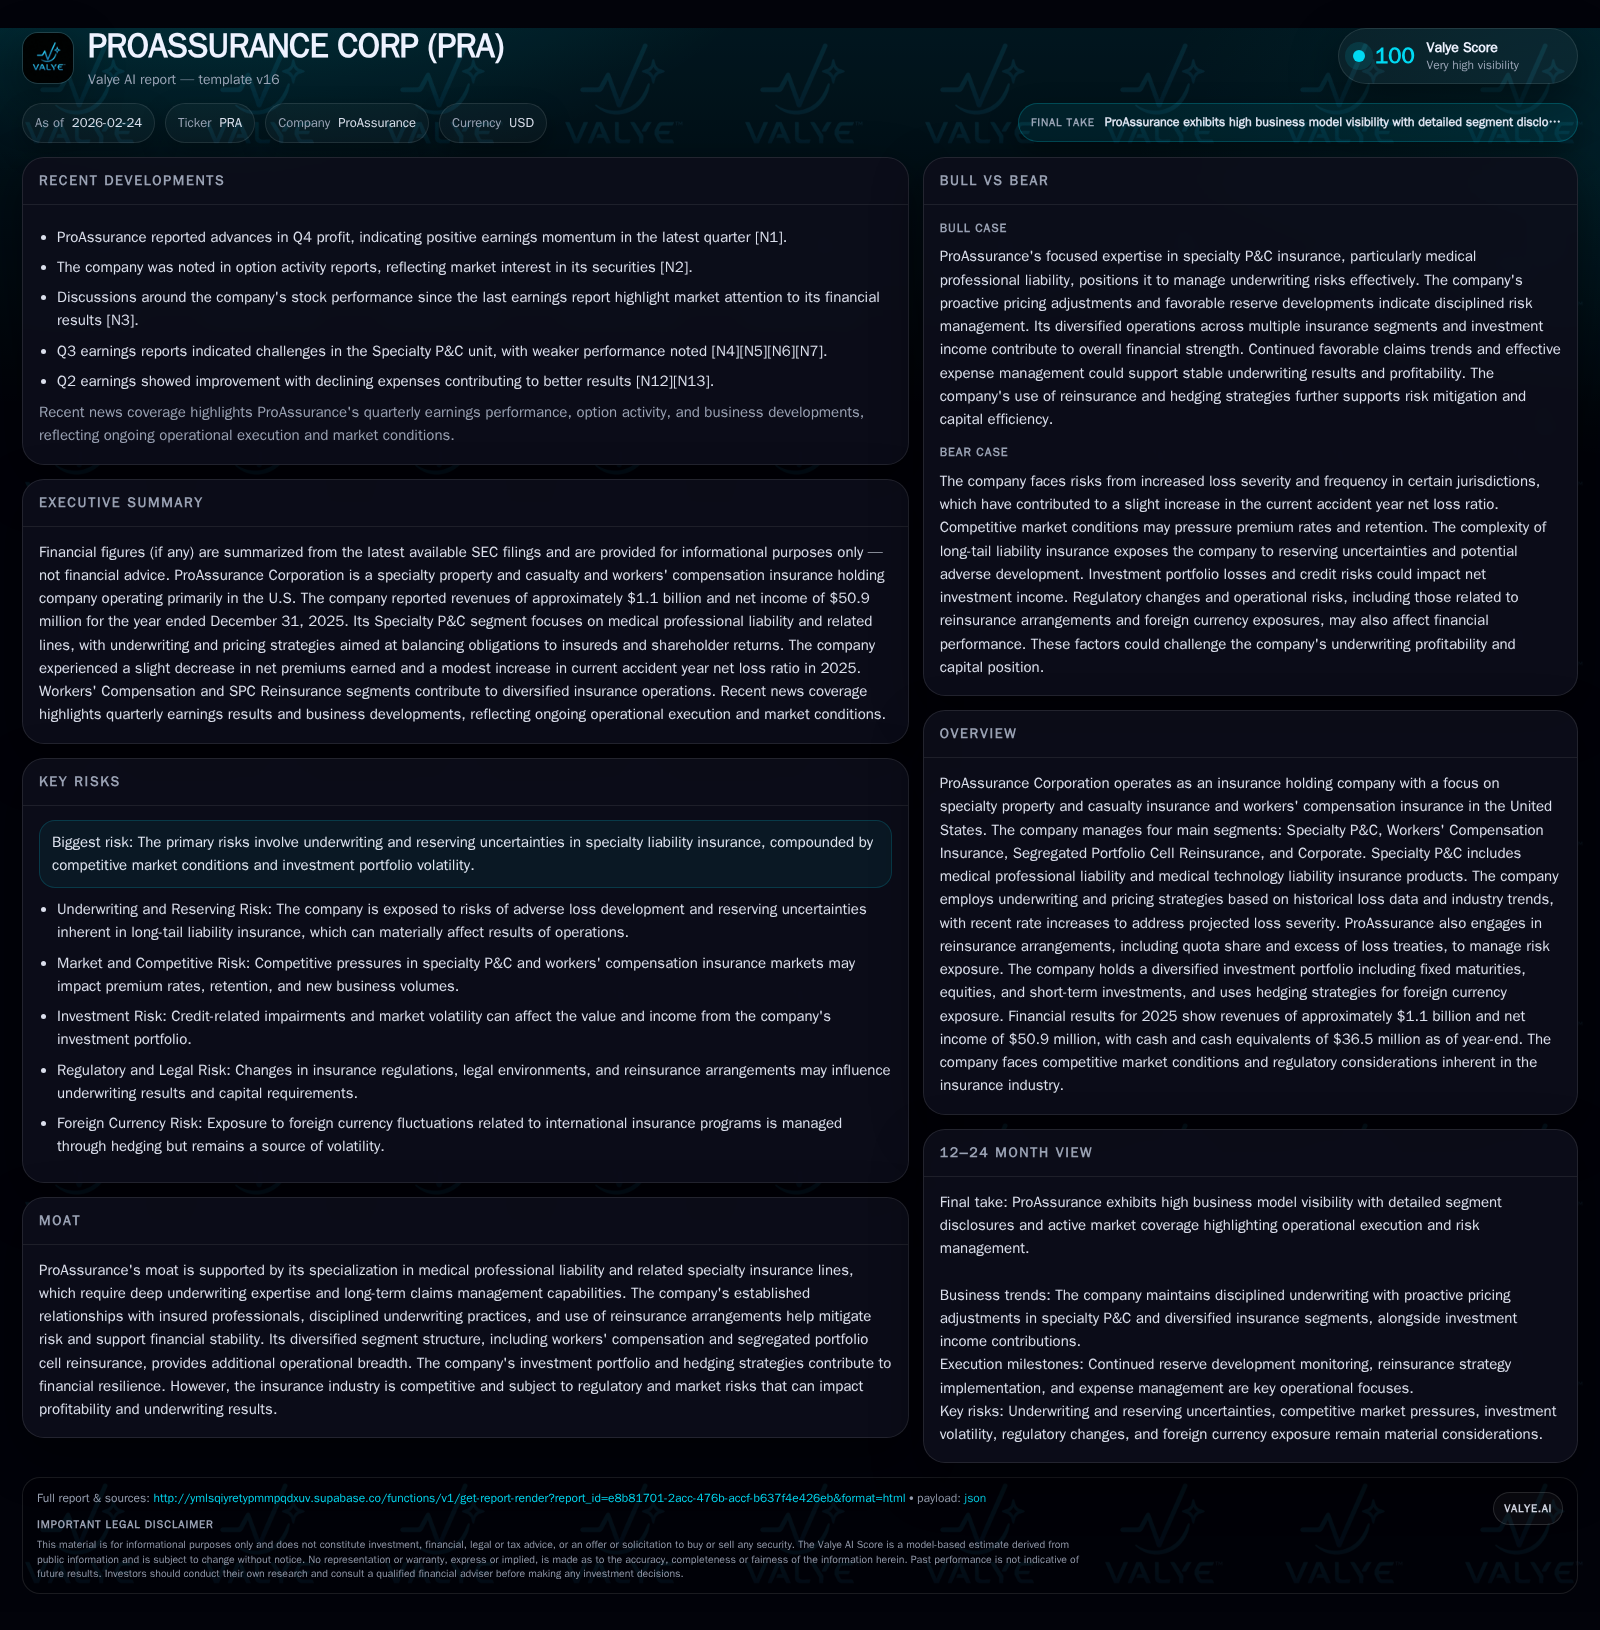
ProAssurance Corporation's modest revenue decline of 4.6% in 2025 contrasts with a return to net profitability after multi-year losses, underscoring operational shifts within its Specialty P&C segment focused on medical professional liability insurance. The company’s disciplined rate increases of approximately 8-10% in renewal pricing aim to address increasing projected loss severity, but retention challenges persist amid competitive alternatives such as captives and hospital affiliations. ProAssurance’s investment portfolio remains concentrated in high-quality fixed maturities (~92% investment grade), complemented by hedging strategies like foreign currency forwards and interest rate swaps that manage balance sheet volatility. Capital allocation reflects prudence: dividends have been suspended since 2024 while share repurchases continue, supporting shareholder returns against underwriting and reserving uncertainties.
Specialty P&C Segment: Evolving Underwriting Trends and Pricing Impact
ProAssurance's core specialty business, representing medical professional liability (MPL) insurance along with medical technology liability coverage, continues to experience nuanced operational shifts. In fiscal year 2025, the Specialty P&C segment recorded new business premiums of approximately $32.6 million, up moderately from $31.4 million in the prior year [S22]. However, retention rates for MPL business steadied at about 84%, down slightly from higher rates the previous year (notably a decline from 91% among Medical Technology Liability) reflecting competitive pressures [S22].
The company implemented renewal pricing increases averaging between 8-9% across specialty lines, motivated by projections of rising loss severity based on actuarial models using historical claim data and industry trends [S1][S22]. This pricing discipline aligns with management’s stated commitment to balancing obligation fulfillment with sustainable long-term returns [S22]. Reinsurance arrangements comprising quota share treaties and excess of loss coverage remain critical risk management tools, transferring portions of potential large payouts to reinsurers at predetermined ceding premium rates [S1].
Operationally, ProAssurance contends with insureds gravitating towards captive insurance programs or self-insured arrangements often when physicians consolidate under hospital systems or large group practices—a trend that weighs on retention but also limits less profitable or higher-risk exposures [S22]. As such, the company exercises selective underwriting renewals to maintain portfolio quality.
Historical Financial Performance: Revenue, Income, and Cash Flow Trajectories
ProAssurance experienced a modest contraction in top-line revenue in FY2025 compared to FY2024—declining from approximately $1.15 billion to $1.10 billion, a reduction of roughly 4.6% year-over-year [F1]. This decrease partly reflects the aforementioned retention challenges within Specialty P&C along with evolving mix shifts.
Net income rebounded solidly into positive territory at about $50.9 million for FY2025, recovering from a steep loss of $38.6 million posted in FY2023 and a marginal break-even result in FY2022 [F1]. Despite this profitability recovery on an accrual basis, cash flows tell a more cautious story: operating cash flow remained persistently negative at -$25.6 million during FY2025 following -$10.7 million the prior year and significantly worse outflows previously [F1]. Coupled with stable capital expenditures around low single-digit millions (flat relative to preceding years), this indicates ongoing claims settlement activity and reserve funding absorb liquidity.
Historical performance (annual)
| FY | Rev ($mm) | Net ($mm) | CFO ($mm) | Rev YoY | Net YoY |
|---|---|---|---|---|---|
| 2025 | 1098 | 51 | -26 | -4.6% | -3.5% |
| 2024 | 1150 | 53 | -11 | +1.2% | +236.6% |
| 2023 | 1137 | -39 | -50 | +2.8% | -9503.0% |
| 2022 | 1107 | 0 | -30 |
Note: Omitted columns lack sufficient annual XBRL coverage in the provided tags (need ≥2 annual points): OpInc, Capex, FCF. Source: SEC companyfacts cache [F1].
Capital returns and efficiency (annual)
| FY | Div ($mm) | Buybacks ($mm) | ROE% |
|---|---|---|---|
| 2025 | 0 | 3.8 | |
| 2024 | 0 | 4.4 | |
| 2023 | 5 | 50 | -3.5 |
| 2022 | 11 | 3 | -0.0 |
Source: SEC companyfacts cache [F1].
Table Note: Capex annual data unavailable for recent years; omitted from YoY calculation.
Drivers of Growth Deceleration and Loss Reserve Dynamics in Medical Professional Lines
Underwriting results in ProAssurance's specialty lines remain exposed to considerable uncertainty stemming from long-tailed liability claims inherent to medical professional liability insurance [S21][S29]. Reserve adequacy requires sophisticated modeling of incurred but not reported (IBNR) claims which constitute a material portion of total reserves—nearly $3 billion gross as of December-end 2025—with extensive actuarial judgment applied semi-annually [S21].
Recent management commentary highlights expectations for increasing projected loss severity prompted selective rate adjustments averaging closer to high single digits year-over-year [S1][N1]. Nonetheless, growth faces headwinds through insured attrition due to competitive captive insurance alternatives or insurer non-renewals following underwriting evaluations [S22]. Additionally, longer claim settlement durations typical of medical malpractice cases add complexity to payout timing assumptions impacting cash flow forecasting.
These factors combine to constrain meaningful top-line expansion even as pricing improves.
Balance Sheet Strength: Investment Portfolio Quality and Hedging Strategies
ProAssurance maintains a diversified investment portfolio that remains heavily weighted toward fixed-income securities rated primarily investment grade—constituting approximately 92% of fixed maturities held as of the latest fiscal year-end—supporting credit risk mitigation objectives [S5][S7][F1]. This portfolio encompasses U.S Treasury obligations, corporate bonds predominantly rated above BBB-, state and municipal bonds as well as asset-backed securities characterized by moderate durations near three years [S7][S16].
Beyond traditional fixed-income markets, the company allocates capital into alternative investments including limited partnership (LP) funds focused on private debt instruments with variable liquidity profiles subject to redemption restrictions necessitating careful cash flow planning [S8][S12][S26].
Risk management complements include hedging foreign currency exposures tied to international insurance portfolios by transitioning during early-mid-2025 from holding foreign-denominated bonds toward shorter-dated foreign currency forward contracts that provide greater flexibility and mitigate volatility [S17]. Moreover, interest rate swap agreements effectively fix borrowing costs slightly above 3% on outstanding revolving credit ($125 million) and term loan ($114 million), stabilizing debt servicing expenses amid rising interest rate environments [S5][S7].
Capital Allocation Review: Dividend Suspension, Buybacks, and Equity Positioning
Since FY2024, ProAssurance has suspended dividend payments as a precautionary measure against underwriting variability and preserving capital flexibility under current reserve pressures [F1][S11]. Meanwhile, active share repurchases continued albeit at a more measured pace compared with historic spikes during periods like FY2023 ($50 million repurchased vs negligible earlier) reflecting management's focus on supporting shareholder value without compromising liquidity cushions.
Equity base expanded steadily reaching nearly $1.35 billion by FY2025-end up from approximately $1.20 billion the prior year signaling retained earnings accumulation through profits alongside moderated repurchase activity [F1]. Calculated return on equity stands around a subdued ~3.8%, trailing what is typically desirable within specialty insurance franchises but consistent given recent loss volatility and reserving enhancements.
Outlook and Risk Factors: Rate Increases, Competitive Landscape, and Market Volatility
Looking ahead, management anticipates sustaining selective renewal pricing elevation strategies aligned with evolving loss severity indicators while navigating intensifying competition from alternate risk-bearing structures including risk retention groups and captive insurers favored by some insured clientele segments [S4][N1]. Regulatory scrutiny remains an omnipresent external factor capable of influencing underwriting terms or claims outcomes though no immediate changes are disclosed.
Investment returns may continue facing compression due to prevailing market conditions despite high credit quality holdings; attendant credit impairments have been minor but require ongoing monitoring given potential sector-specific risks within corporate bonds noted during the past year [S6][S25][N1]. The inherent long-tail nature of professional liability lines predicates reserve estimates that present continual judgment-based adjustments introducing earnings volatility.
Metrics to Monitor: What Will Define ProAssurance's Next Chapter?
Given absent explicit forward guidance beyond existing commentary [N1][S1], stakeholders should closely track several key metrics:
- Premium growth trends separately tracked between MPL specialty lines versus workers’ compensation exposure,
- Quarterly updates on prior year loss reserve development signaling adequacy or need for further strengthening,
- Investment portfolio yield trends relative to benchmark rates,
- Stability ratings assigned by NRSROs on invested fixed-income holdings,
- Operating cash flow trajectories reflecting claims payment timing improvements,
- Any regulatory or judicial developments impacting claims litigation or licensing. Monitoring these indicators will illuminate the balance between growth ambitions, underwriting discipline efficacy, and capital resilience essential for sustained enterprise value creation.
Disclaimer: This analysis is intended solely for informational purposes based on publicly available filings and news reports as of February 24, 2026; it does not constitute investment advice or recommendations.
Disclaimer: This is research-only, informational analysis and not investment advice. It may include AI-generated interpretation and general industry context. Always verify important details using primary sources.
Comments