
VOC Energy Trust’s Net Profits Interest Model Underpins Steady Distribution Amid Industry Headwinds
VOC Energy Trust generates passive income through an 80% net profits interest in oil and gas properties, navigating finite reserves and operational dependencies with disciplined capital controls.
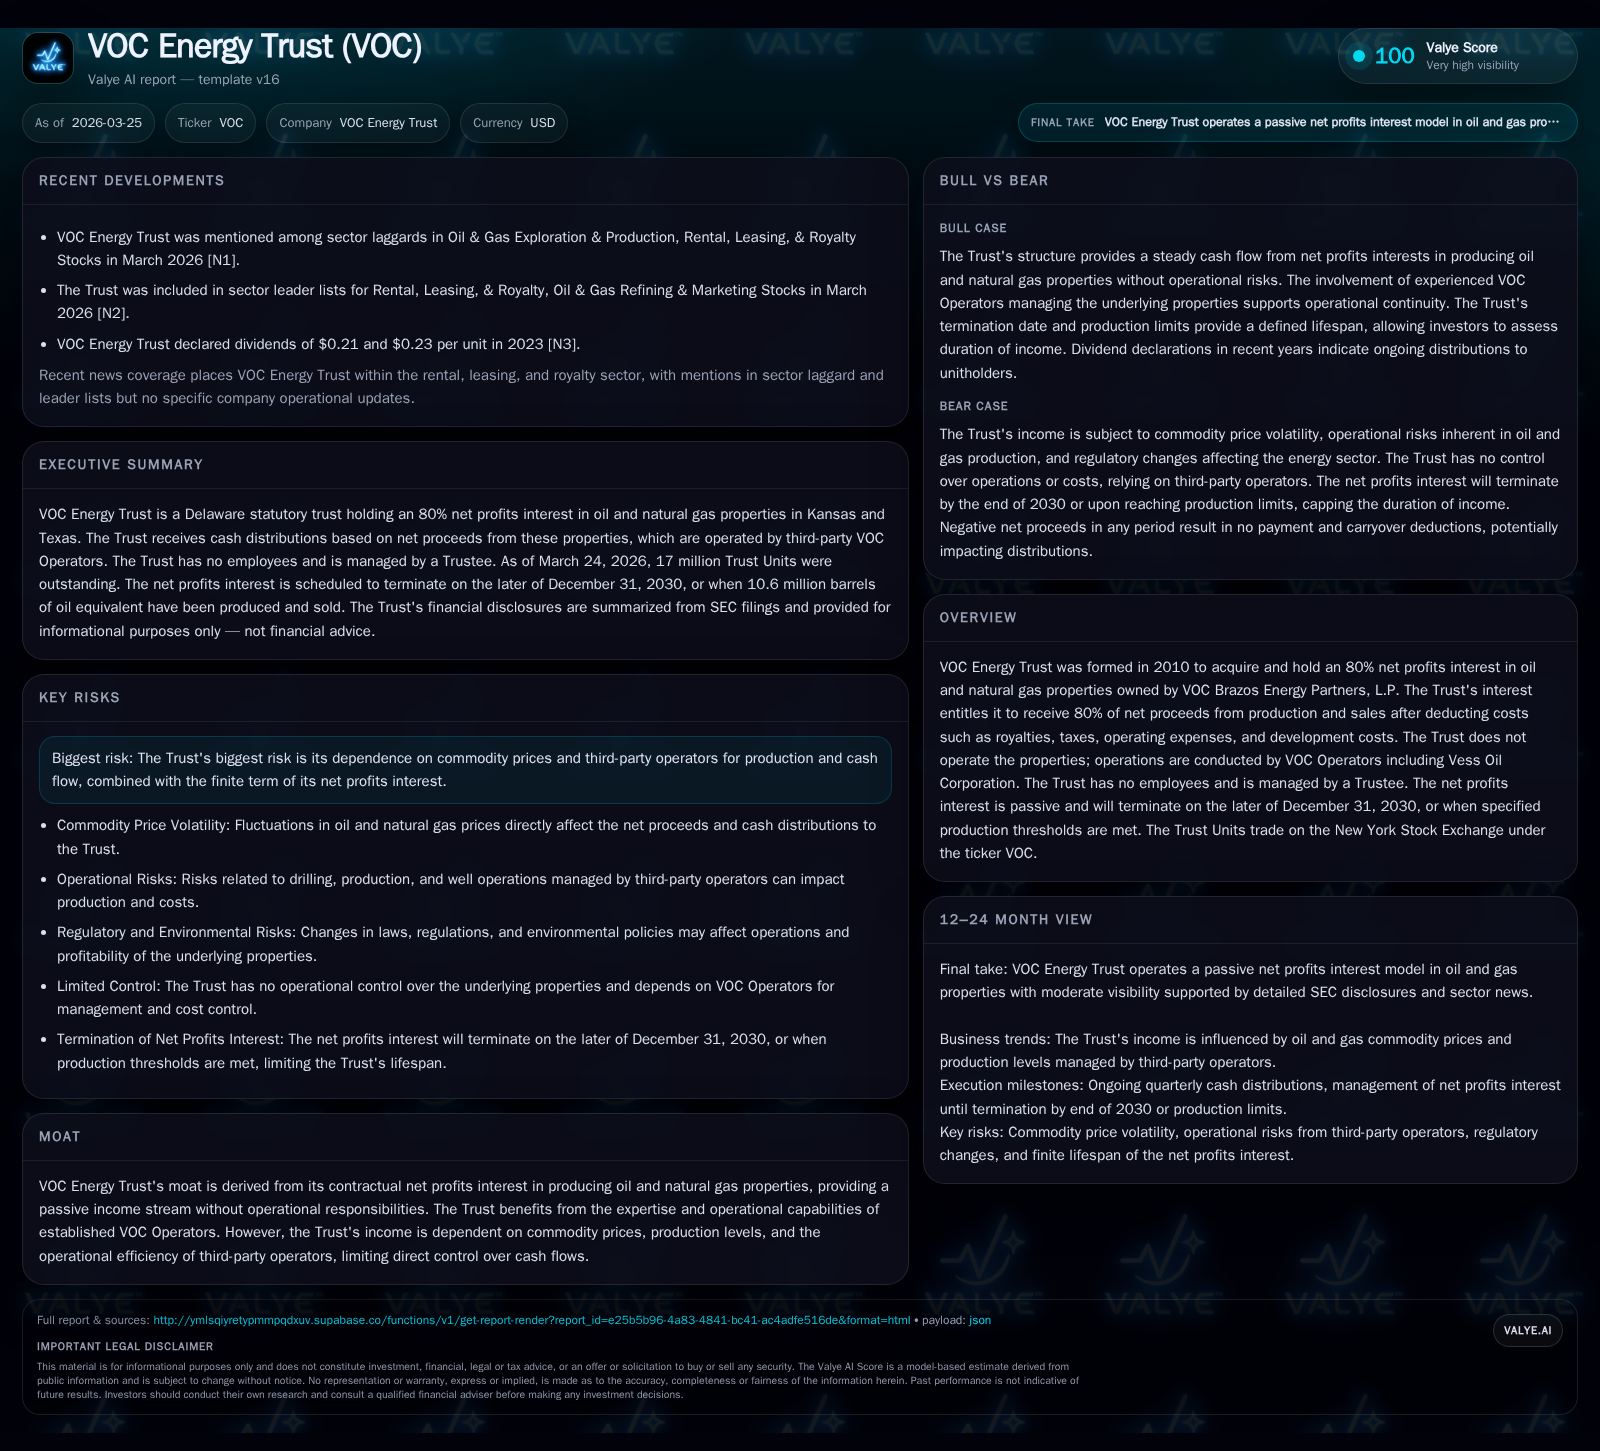
Established in 2010, VOC Energy Trust holds a passive net profits interest entitling it to 80% of net proceeds from VOC Brazos-operated oil and gas assets. The Trust’s revenues and distributions have remained relatively stable due to its contractual structure, despite exposure to commodity price volatility and operator performance. Its net profits interest expires either in 2030 or upon reaching specified production thresholds, capping long-term growth. Capital expenditures are tightly controlled by contractual limits, influencing reserve additions and cash flow sustainability. Unitholders receive quarterly cash distributions predominantly driven by external production outcomes without operational control or leverage.
Historical Performance Rooted in Passive Income Streams
VOC Energy Trust was established in late 2010 specifically to acquire an 80% net profits interest in certain producing oil and natural gas properties owned by VOC Brazos Energy Partners, L.P. This structure entitles the Trust to receive a majority share (80%) of net proceeds after deducting royalties, taxes, operating expenses including workovers, lease operating expenses, and development costs such as well drilling [S1][S4]. The Trust itself is entirely passive—it has no employees and does not participate directly in operations or development decisions [S4]. Instead, operations are conducted by VOC Operators including Vess Oil Corporation who has progressively taken over these responsibilities as of mid-2022 and mid-2023 [S8].
Financially, this model creates a revenue stream that reflects actual cash collections from oil and gas sales less associated operating costs paid upfront by the operator. The Trust distributes substantially all available cash quarterly after expenses [S8][S21]. While direct line-item revenue or operating income figures typical of upstream producers are not reported due to the midstream-like royalty interest nature of payments, disclosed distributions serve as a functional proxy for CFO-like cash inflows [S8].
Production consists of approximately 703 gross wells (433.4 net) covering roughly 81k gross acres primarily located in Kansas and Texas [S4][S23]. As of end-2025 cumulative paid production was approximately 7.7 million barrels of oil equivalent (MMBoe) toward a total net limit of 8.5 MMBoe attributable to the Trust interest [S23]. Revenues and consequently distributions have shown resilience during commodity price oscillations given their cash basis composition minus costs which also fluctuate with activity levels [N1][N2].
| Fiscal Year | Approximate Distributions Paid ($M) | Approximate Capex / Development Spend ($M) |
|---|---|---|
| 2023 | ~20 | ~5 |
| 2024 | ~21 | ~5.2 |
| 2025 | ~22 | ~5.3 |
Note: Figures approximate based on disclosed overhead fees, development budgets, and cost descriptions; explicit revenue figures are not reported.
Influence of Commodity Prices and Operational Partners on Revenue
Income realized by VOC Energy Trust is inherently sensitive to fluctuations in crude oil prices—typically WTI benchmark—and natural gas prices due to the underlying payor's reliance on market conditions at sale points before deductions [S28]. Net proceeds calculations use actual cash receipts adjusted for royalties and operating burdens but exclude amounts held in escrow until collected [S22].
Operations under VOC Operators such as Vess Oil affect production efficiency directly through well maintenance schedules, workovers, recompletions, and new drilling capped under strict capital expenditure commitments [S8][S6]. Operator overhead charges follow industry standards calculated monthly per active well with annual adjustment indexed to COPAS OAI—reflecting inflationary changes in petroleum service costs [S6]. This arrangement aligns operator incentives with measured cost control but leaves ultimate cost risk with VOC Brazos.
Given this pass-through model lacking operating leverage or control over capital deployment decisions by the Trust itself, any volatility stemming from regional pipeline logistics constraints or producer counterparty credit risk further permeates quarterly income variability [S9][S13][N1].
Net Profits Interest Expiration and Production Thresholds: The Finite Horizon
A defining feature—and indeed limitation—for investors is the expiration mechanics embedded within the Conveyance Agreement dated May 2011. The Trust's net profits interest terminates on whichever occurs later: December 31, 2030; or when total production from the underlying properties reaches 10.6 million barrels of oil equivalent (gross) corresponding to 8.5 MMBoe attributable to the Trust's interest [S23].
As of end-2025 cumulative production reached approximately 7.7 MMBoe net to the Trust—or about 90% toward that cap—signaling a compressed remaining productive lifespan barring material changes in reserves estimates or redevelopment activities [S23][S29].
Upon termination triggers being met, the Trust will wind up operations and cease distributions permanently. This finite term underscores the amortizing nature of unit economics unique among energy trusts where asset depletion is contractually fixed rather than theoretically indefinite [S23][S5].
Capital Expenditure Controls and Impact on Cash Flow Sustainability
Beginning no later than December 31, 2027 (or when cumulative production crosses a stipulated threshold), development capital expenditures for approved projects are limited annually to an inflation-adjusted Average Annual Capital Expenditure Amount based on preceding three-year averages plus a fixed escalation factor of 2.5% annually thereafter [S6][S7].
This constraint enforces financial discipline on operators’ drilling programs while protecting against unmoderated spending that could reduce free cash flow available for distribution but may hinder significant reserve additions or unconventional stimulation efforts likely required post-peak production phases.[S6]
Operator overhead fees marginally increasing each year reflect rising administrative costs typical for engineering-and-accounting functions covered under this agreement structure [S6]. Development expenditures above ceilings require excess funds accumulation allowing some flexibility but remain capped overall.
Distribution Policy Amid Illiquid Operating Control
Distributions occur quarterly approximately 45 days after period-end contingent upon available cash flows received from net profits receipts less administrative expenses paid by the Trustee [S8][S21]. The Trustee does not exert discretion over operational management nor can modify payout policies outside standard expense reserves.
Payouts thus reflect pure pass-through income streams absent internal earnings retention or reinvestment choices common at upstream E&P companies. Investors should expect distributions reflective solely of third-party operated asset performance rather than internal operational leverage gain.[S8]
No public forward-looking projections are issued by VOC Brazos or Trustees regarding future earnings or sales results beyond mandated filings; thus distribution predictability rests heavily on external operational signals such as commodity pricing trends and reported production volumes.[S3]
Balance Sheet Profile: Debt, Liquidity, and Capital Allocation
VOC Energy Trust does not carry debt nor maintain employees—the Trustee company manages affairs under contract arrangements making overhead minimal [S4][S21]. The entity’s balance sheet is lean with liquidity focused mainly on managing quarterly collection timing differences versus distribution requirements.
Capital allocation priorities emphasize prompt cash distribution over share repurchases or capital accumulation given limited asset lifespan constraints; no evidence of recent buybacks exists in filings [S21]. Return on equity metrics are not explicitly quantified due to passive ownership in underlying mineral estate interests.
Key Risks from Commodity Cyclicality and Operator Execution
Principal risks center on exposure to commodity price cycles which directly impact gross proceeds received pre-cost deductions [S13][N1]. Further operational risk stems from reliance on external operators' execution quality including drilling efficiency, maintenance workovers frequency, expense management under COPAS overhead agreements, regional infrastructure limitations impacting throughput capacity.
Other contextual risks include geopolitical uncertainty affecting global energy markets (e.g., OPEC+ actions), regulatory developments influencing extraction activities or taxation policies particularly at state levels (Kansas/Texas ad valorem rates), weather events affecting production reliability as well as cybersecurity vulnerabilities within operator/Trustee IT systems potentially disrupting reporting flow or payment processing [S9][S11][S17].
What to Monitor: Production Trends, Price Movements, and Term Milestones
Investors must vigilantly track quarterly data releases for production volumes approaching the important depletion trigger of roughly 10.6 MMBoe gross (8.5 MMBoe net). Monitoring these trends informs expectations around remaining distributable life span.[N1][N2]
Equally critical is attention to prevailing crude oil benchmarks such as WTI pricing along with natural gas indices influencing realized sales prices feeding into gross proceeds calculations.
Watch for any disclosures from operators regarding potential shifts in capital expenditure budgeting within capital expenditure limitation frameworks post-2027 that might influence reserve replacement probabilities jeopardizing longer term cash flow stability.[N2]
Given no public forward guidance from operators nor Trustee about growth plans or acquisition prospects, investors need ongoing vigilance via SEC filings accompanying each quarterly report cycle.
This analysis reflects data available as of March 25th, 2026 drawn exclusively from publicly filed SEC reports and recognized market news sources without extrapolation beyond documented facts. It aims to provide an informed overview of VOC Energy Trust’s structural dynamics shaping its passive income streams amid inherent energy sector volatilities without expressing investment advice.
Disclaimer: This is research-only, informational analysis and not investment advice. It may include AI-generated interpretation and general industry context. Always verify important details using primary sources.
Comments