
Oak Valley Bancorp’s Local Real Estate Focus Fuels Steady Regional Growth
A regional bank anchored in Central California leverages its real estate expertise and disciplined capital management to sustain earnings amid concentrated market exposure.
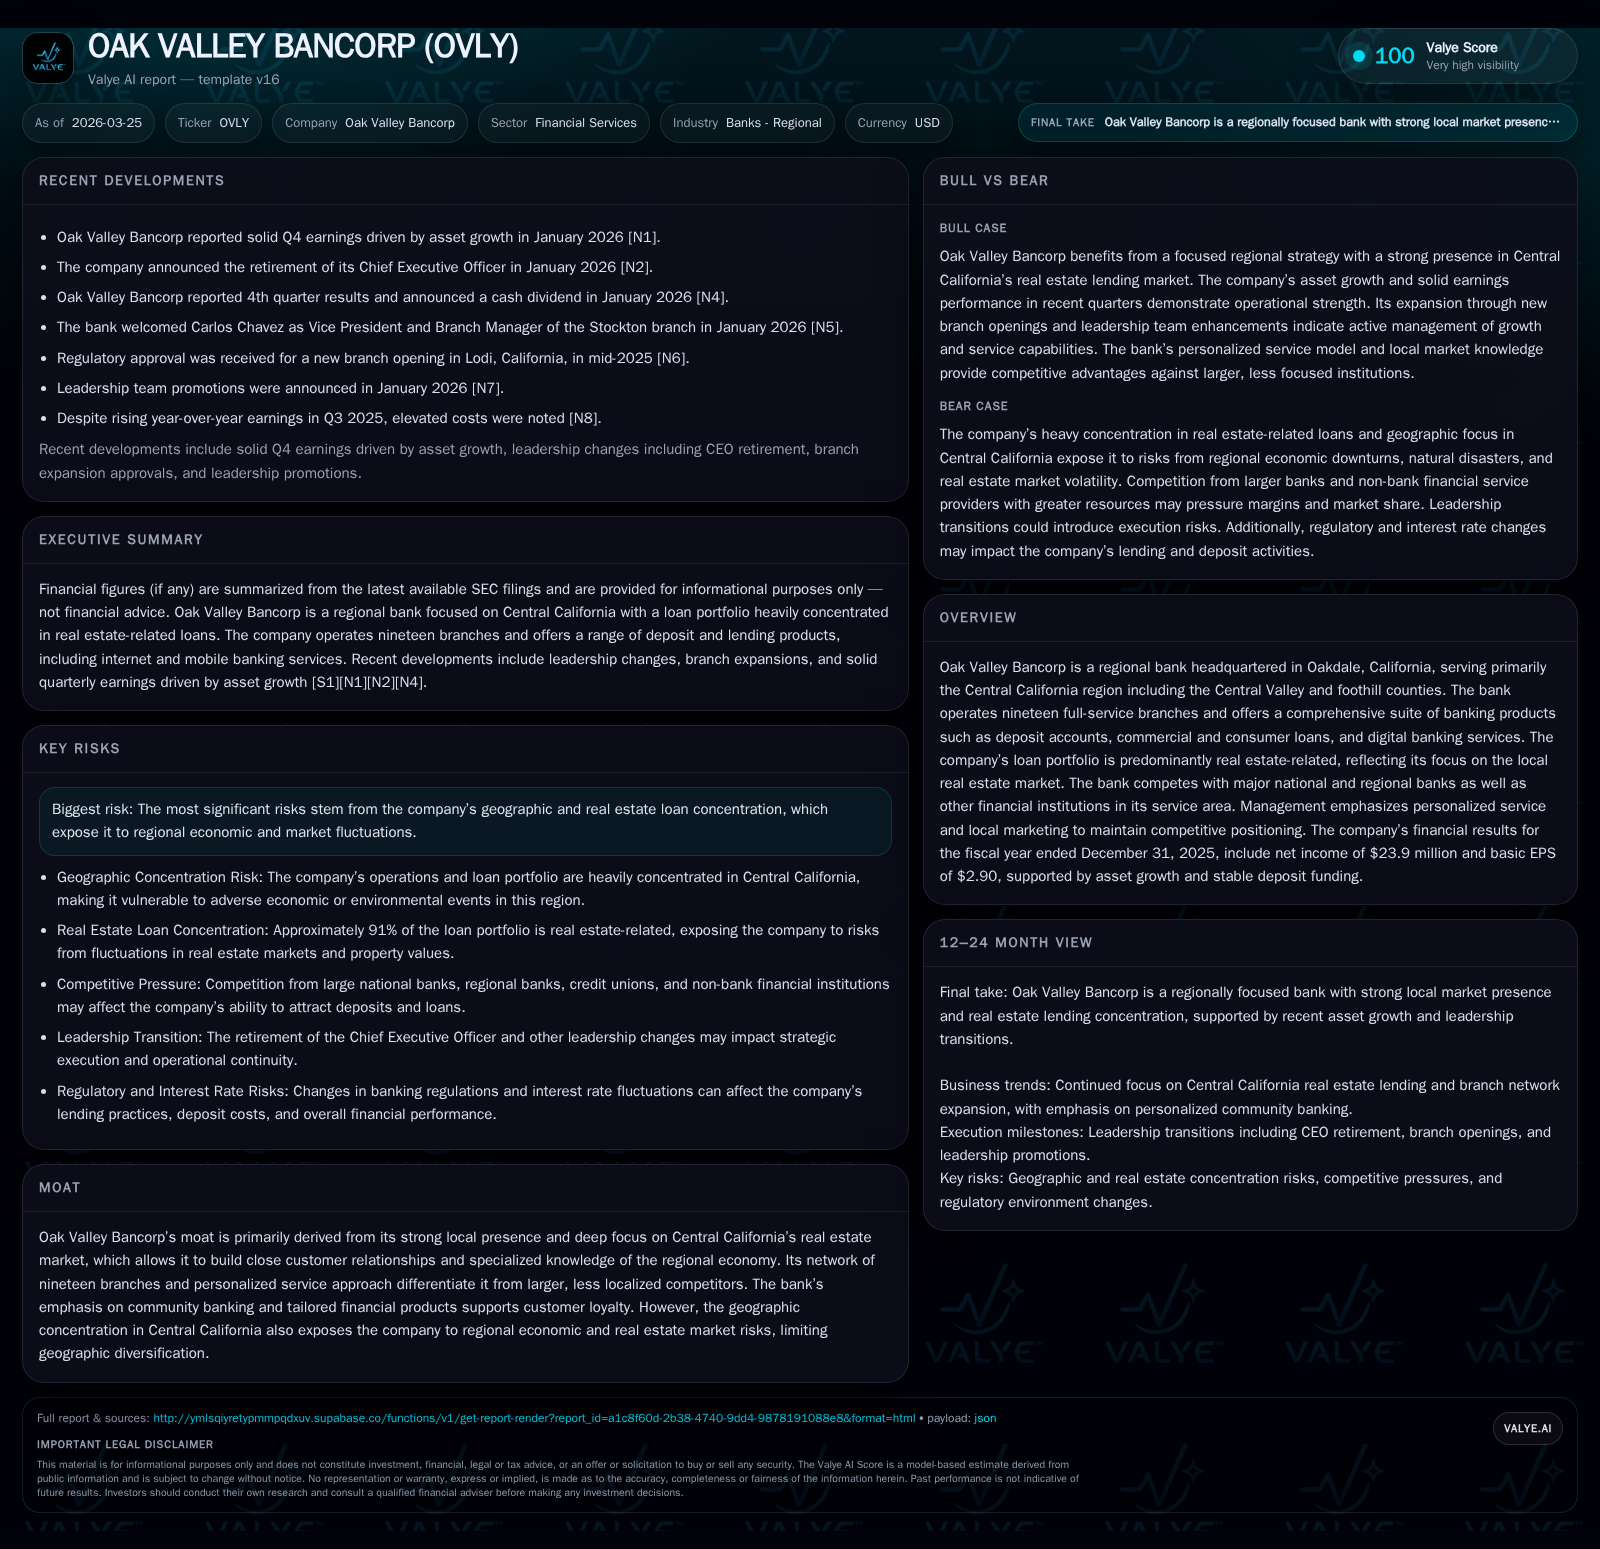
Oak Valley Bancorp’s historical growth has been largely driven by its deep local presence and a loan portfolio heavily weighted toward real estate in Central California. The bank reported $23.9 million net income for 2025, a slight year-over-year decline driven partly by economic headwinds, while operating cash flow grew and capital expenditures increased notably to support infrastructure. Its geographic concentration offers competitive advantages through specialized local credit risk appraisal but also concentrates exposure to regional market and economic cycles. Oak Valley maintains disciplined capital allocation with steady dividend growth, healthy equity expansion, and robust liquidity anchored by a stable deposit base. Future growth will depend on regional economic trends and continued execution of community banking strengths alongside potential incremental digital enhancements.
Historical Growth Driven by Local Real Estate Lending
Historical performance (annual)
| FY | Net ($mm) | CFO ($mm) | Capex ($mm) | Net YoY |
|---|---|---|---|---|
| 2025 | 24 | 29 | 4 | -4.1% |
| 2024 | 25 | 26 | 2 | -19.1% |
| 2023 | 31 | 33 | 2 | +34.7% |
| 2022 | 23 | 23 | 1 |
Source: SEC companyfacts cache [F1].
Capital returns and efficiency (annual)
| FY | Div ($mm) | FCF ($mm) | ROE% |
|---|---|---|---|
| 2025 | 5 | 25 | 11.5 |
| 2024 | 4 | 24 | 13.6 |
| 2023 | 3 | 31 | 18.6 |
| 2022 | 2 | 22 | 18.1 |
Source: SEC companyfacts cache [F1].
Oak Valley Bancorp’s trajectory of growth over recent years is tightly woven with its specialization in lending predominantly within Central California's vibrant real estate markets. From fiscal year 2022 through 2025, net income demonstrated a generally positive trend with some volatility attributable to economic oscillations impacting the real estate sector. Specifically, net income climbed from $22.9 million in 2022 to peak at $30.8 million in 2023 before moderating to $24.9 million in 2024 and further to $23.9 million in 2025 [F1]. This performance reflects the bank’s localized footprint which centers on nineteen full-service branches strategically placed throughout Central Valley counties such as San Joaquin, Stanislaus, Tuolumne, Sacramento, and Placer [S9].
The loan book is heavily skewed toward real estate-related lending—over 91% of the loan portfolio as of December 31, 2025—comprising construction loans, mini-perm loans, residential mortgage loans, and commercial real estate facilities secured by real property [S7], [S8]. Approximately 97% of this segment is commercial real estate loans where typical terms involve up to ten-year maturities with amortization schedules extending to twenty-five years and loan-to-value ratios capped around 75%. Notably, non-owner occupied commercial real estate represents about 69.9% of these commitments, with a conservative average loan-to-value ratio near 45.6%, signaling prudent collateralization practices underpinning the portfolio quality [S8]. Such granularity affords Oak Valley an edge in local credit risk assessment versus larger competitors lacking comparable regional insight.
The branch network enhances proximity to clients enabling personalized relationship management—a cornerstone differentiator from major national banks competing in the same markets like Wells Fargo or Bank of America [S21]. This close interface nurtures community banking qualities often prized by small businesses and individual customers who value tailored lending solutions closely aligned with Central California’s economic realities.
2025 Financial Performance Highlights and Year-Over-Year Trends
The fiscal year ended December 31, 2025 saw Oak Valley report net income of $23.9 million which represents a decrease of about 4.1% compared with $24.9 million recorded in the prior year; this retreat aligns with headwinds faced locally including tighter credit conditions or shifts in real estate transaction volumes impacting loan demand or yields [F1]. Notwithstanding this drop in profitability measured on a GAAP basis, operating cash flow rose significantly by approximately 11.8% to reach nearly $28.7 million for the year—an indication of improving underlying cash generation efficiency within core operations [F1].
Capital expenditures jumped sharply by roughly 130.9%, from about $1.78 million in 2024 to over $4.1 million in the most recent period—a likely reflection of strategic investments aimed at upgrading branch infrastructure or digital capabilities crucial for sustaining competitive service delivery in a technology-driven environment [F1], [S11]. Equity climbed as well by over $24 million or roughly 13%, ending the year at approximately $208 million which supported an approximate return on equity measured near 11.5%, consistent with stable profitability relative to book value enjoyed over recent years [F1]. Earnings per share came in at a solid $2.90 for the period.
These results encapsulate a stable revenue footprint buttressed by disciplined expense management despite some pressure on top-line growth due to specific localized economic challenges faced within their operating region.
Geographic Concentration: Strengths and Risk Implications
Oak Valley Bancorp’s deliberate concentration within Central California stands as both its defining strength and primary risk vector. The bank’s unwavering focus on serving customers predominantly across seven counties—spanning agricultural heartlands and ascending into Sierra foothills—enables it to cultivate unmatched knowledge about local market trends, borrower profile nuances, and real estate collateral valuations critical for prudent lending decisions [S7], [S9].
However, this hyper-localized strategy inherently amplifies risk exposure tied tightly to regional economic cycles—particularly those influencing residential and commercial real estate markets which comprise the backbone of their loan book (91%) [S24]. Adverse developments such as commodity price fluctuations affecting agricultural incomes or macroeconomic shifts curbing demand for retail/commercial spaces can disproportionately impair asset quality.
Furthermore, geographic concentration heightens vulnerability toward natural catastrophes like earthquakes or floods known historically within California's diverse landscape—all factors requiring vigilant risk monitoring through conservative underwriting frameworks demonstrated via low aggregate loan-to-value ratios (~45%) and robust debt coverage mandates on commercial credits [S8], [S12]. This blend embodies classic tradeoffs between niche specialization versus diversification benefits commonly grappled with among regional financial institutions.
Future Outlook: Growth Prospects Within the Central California Economy
Absent specific forward guidance or new material announcements ([N#] none available), Oak Valley’s growth trajectory appears chiefly contingent upon continuing demand for real estate financing fueled by ongoing demographic and economic developments across Central California as well as enhanced digital service offerings aligning with evolving customer preferences.
The company references evaluating options such as increasing branch density where warranted by demand alongside further cultivating technologically enabled banking channels including mobile check deposit and online bill pay functionalities that augment traditional relationship banking experiences—the latter being crucial given increasing fintech competition even within regional banking segments ([S11]) .
Sector-wide trends indicate that regional banks maintaining localized customer intimacy paired with selective tech adoption stand best positioned to navigate competitive pressures from both national money centers and emergent non-depository fintech entrants.
Capital Allocation Strategy and Shareholder Returns
Capital stewardship at Oak Valley emphasizes stable dividend distributions coupled with cautious reinvestment priorities evidenced by growing dividends paid which rose from approximately $2.47 million in FY2022 to $5.02 million by FY2025—a doubling over four years reflective of management’s commitment to shareholder income while maintaining balanced payout ratios per available earnings capacity [F1].
Share repurchases have been historically limited (last notable activity more than a decade ago) indicating prioritization of internal capital retention for organic growth initiatives over aggressive buyback programs ([F1]). Return on equity sustains near double-digit levels (~11.5%), attesting to effective utilization of shareholders’ equity amid steady profit margins.
Freely generated cash flows remain robust with free cash flow approximating $24.6 million after accounting for capital expenditures supporting operational flexibility without depending excessively on external funding sources ([F1]). This strong free cash flow profile underpins dividend sustainability alongside potential incremental investments geared towards branch network upgrades or technology platforms.
Liquidity Position and Balance Sheet Health
Liquidity metrics are sound with over $232 million held in cash & equivalents at fiscal year-end—a comfortable buffer against unforeseen liquidity demands or economic disruptions ([F1]). The bank supplements core deposits—which represent approximately 90% of liabilities—with borrowings accessible from the Federal Home Loan Bank up to about $402 million limits secured principally by its extensive portfolio of real estate loans ([S4]).
The deposit franchise exhibits stability owing largely to entrenched relationships fostered through community banking models which reduces volatility typical among regional banks reliant on wholesale funding sources ([S10]). Loan-to-deposit ratios remain appropriately calibrated ensuring sufficient liquid assets backstop assets extended; credit quality receives ongoing scrutiny through multilevel approvals involving senior committees aligned with written policies emphasizing thorough borrower evaluation including third-party appraisals ensuring conservative collateral valuations ([S6], [S10]).
Overall balance sheet metrics reflect prudent asset-liability management practices necessary amid sector-wide challenges posed by fluctuating interest rates and regulatory expectations around capital adequacy ([S14], [S25]).
Key Milestones and What To Monitor Next
No recent material news or strategic announcements have been released beyond routine filings ([N#] none). Attention should focus on upcoming quarterly earnings reports that will reveal effects from changing interest rate environments on net interest margin performance plus any evolving regional market indicators affecting credit demand.
Additionally, tracking management commentary regarding possible branch expansions or digital services enhancements will be important as these could signify incremental growth vectors beyond legacy core strengths.
Monitoring progression of capitalization levels relative to regulatory requirements amidst evolving banking regulations is another crucial focal point alongside vigilance toward any changes in reserves consequent to shifts in allowance for credit losses particularly centered on localized real estate exposures.
Assessing how geopolitical-economic fluctuations impact Central California’s economy remains fundamental given its outsized influence on Oak Valley’s operational health.
This analysis is based solely on information available from company filings dated through March 25, 2026[[F1]], supplemented by SEC exhibits[[S#]] without extrapolation beyond reported figures or non-disclosed forward-looking guidance.
Disclaimer: This is research-only, informational analysis and not investment advice. It may include AI-generated interpretation and general industry context. Always verify important details using primary sources.
Comments