
Marpai’s Tech-Enabled Healthcare Reimagination Amid Financial Strains
Marpai deploys AI-driven solutions to reshape self-insured employer health plans while grappling with severe liquidity pressures.
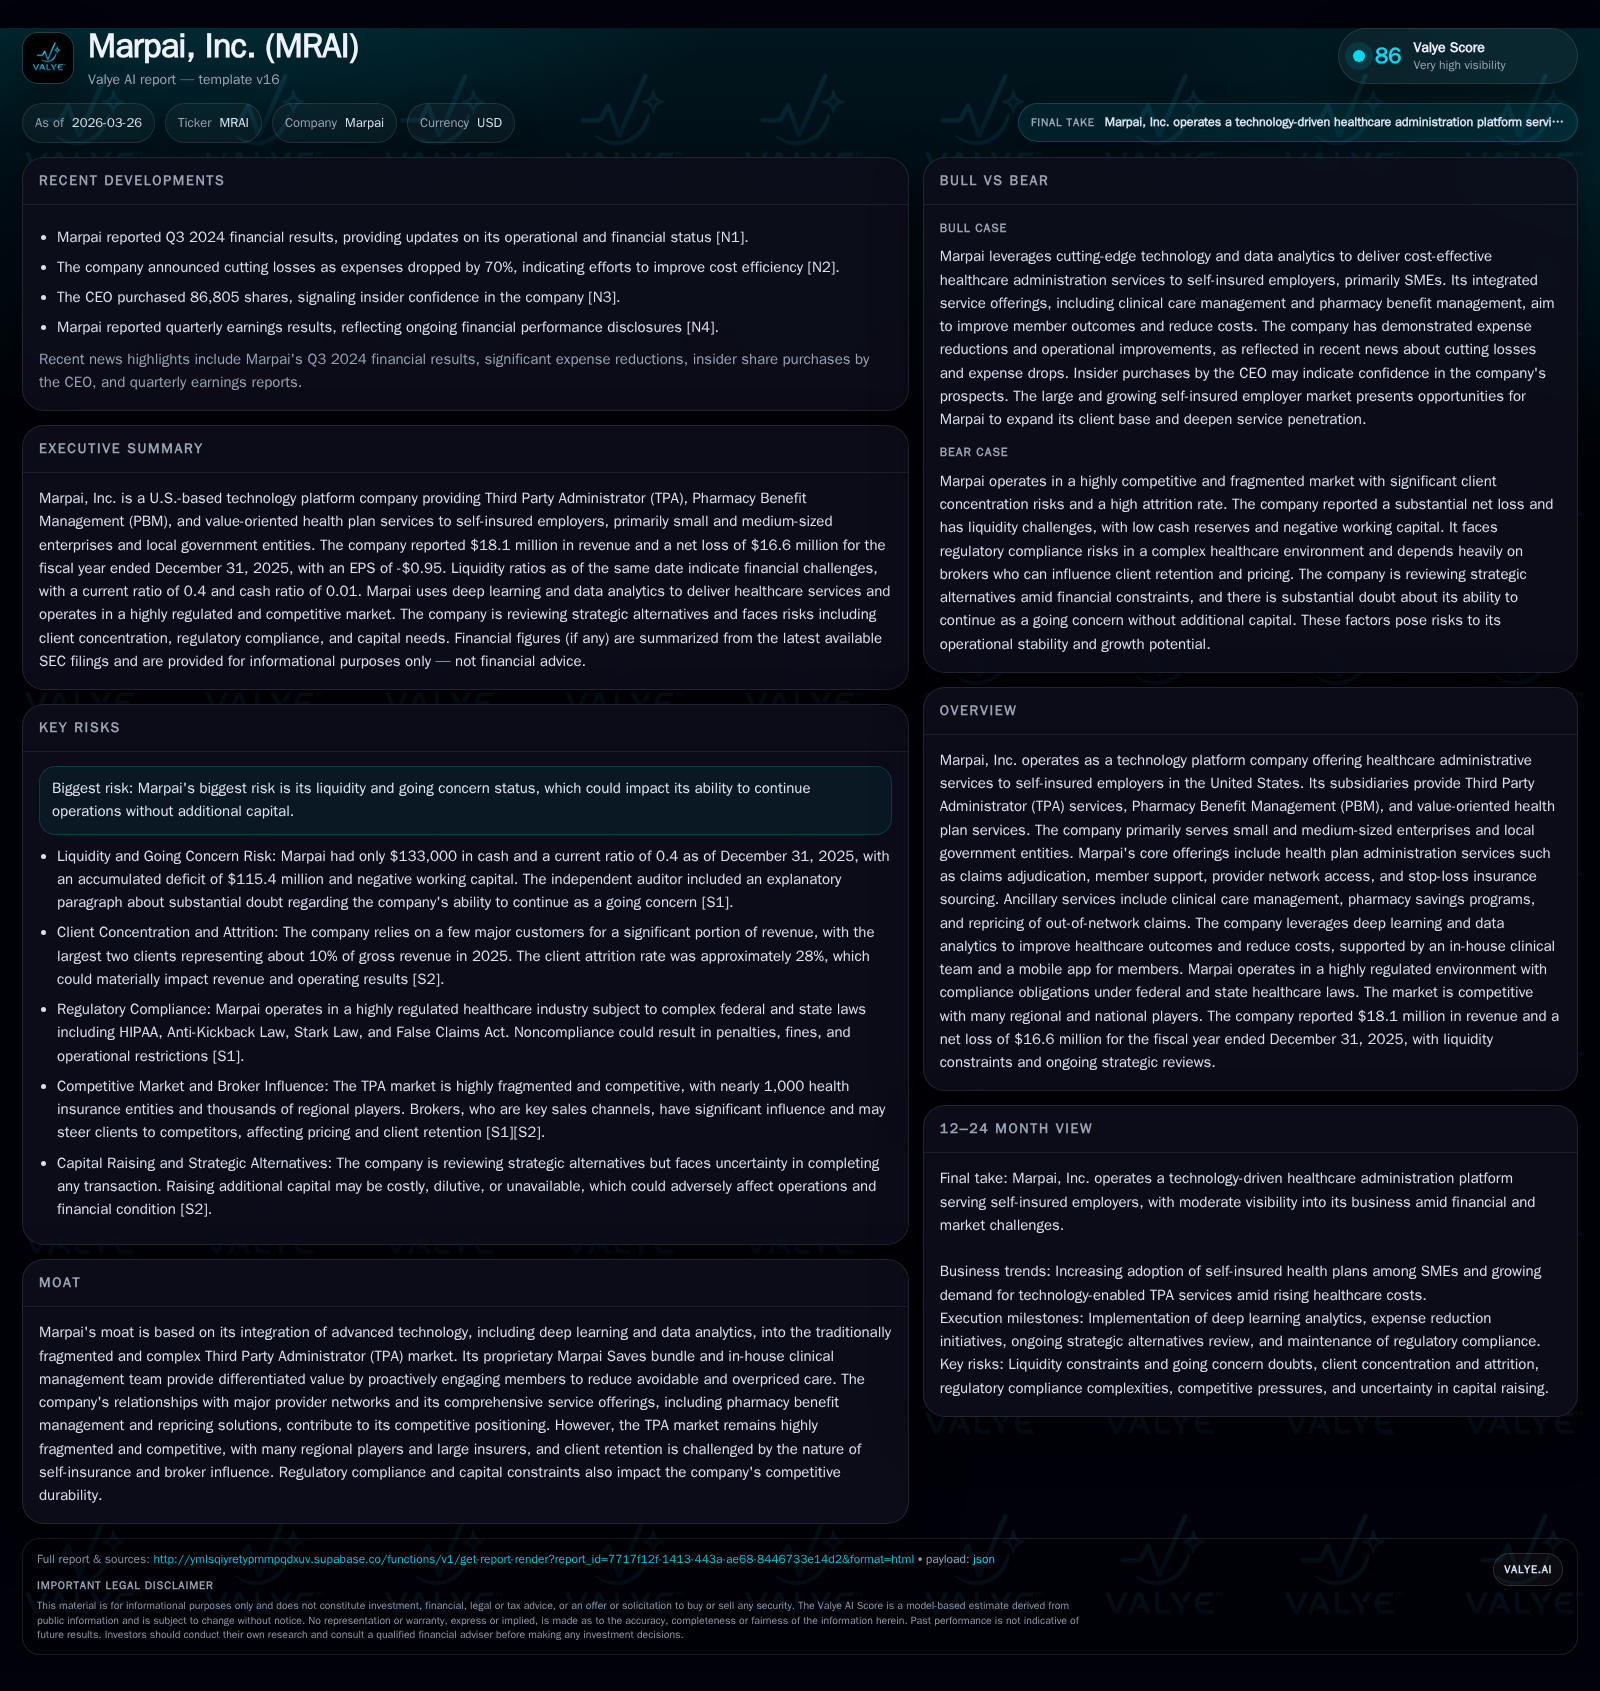
Marpai, Inc. operates in the fragmented third party administrator (TPA) market providing technology-enhanced healthcare administration primarily to self-insured small and mid-sized employers. Despite a steep revenue contraction in 2025, operating losses and cash burn have notably moderated from prior years. The company’s core competitive edge hinges on its deep learning-powered Marpai Saves bundle and in-house clinical team, which target cost reduction and member engagement beyond traditional claims adjudication. However, high client attrition, concentrated customer exposure, broker dependency, and ongoing litigation impose substantial execution risks. Cash scarcity raises substantial doubt about going concern status, emphasizing the need for successful capital raises or strategic alternatives to sustain operations.
Growth Trends and Shifting Financial Performance
Marpai's financials reveal a sharp deceleration in top-line growth during FY2025. Revenue dropped by 35.8% year-over-year from approximately $28.2 million in FY2024 to $18.1 million in FY2025 [F1]. This contraction aligns with elevated client attrition rates around 28% in FY2025, reflecting challenges in customer retention during a competitive TPA landscape [S2], [S11]. Operating income losses improved significantly from -$22.1 million in FY2024 to -$13.5 million in FY2025, representing roughly a 38.6% narrowing but remaining deeply negative [F1]. Net losses also narrowed proportionally to -$16.6 million from -$22.1 million the prior year.
Operational cash flows reflect this tightening; FY2025 posted -$7.45 million versus nearly double the outflow the previous year (-$15.2M), indicating some progress toward cash efficiency despite ongoing burn [F1]. Capital expenditures remained stable at approximately $360k annually across recent years. However, working capital remains strained with current liabilities more than double current assets ($25.7M vs $10.3M), yielding a precarious current ratio below 0.4 at year-end 2025 [F1].
Historical performance (annual)
| FY | Rev ($mm) | Net ($mm) | CFO ($mm) | OpInc ($mm) | Rev YoY | Net YoY |
|---|---|---|---|---|---|---|
| 2025 | 18 | -17 | -7 | -14 | -35.8% | +25.0% |
| 2024 | 28 | -22 | -15 | -22 | +23.2% | |
| 2023 | -29 | -16 | -28 | -8.6% | ||
| 2022 | -26 | -35 | -27 |
Source: SEC companyfacts cache [F1].
Capital returns and efficiency (annual)
| FY | FCF ($mm) | ROE% |
|---|---|---|
| 2025 | 50.9 | |
| 2024 | 79.7 | |
| 2023 | -16 | 214.0 |
| 2022 | -36 | -431.5 |
Source: SEC companyfacts cache [F1].
Table: Historical Financial Performance Snapshot for Marpai Inc., FY2024–2025 [F1]
Technology Integration as Marpai's Market Differentiator
Marpai differentiates itself within the fragmented TPA sector through integration of advanced deep learning capabilities embedded in its proprietary Marpai Saves bundle combined with a nurse-led clinical care management team [S4], [S6]. This technology platform automates claims adjudication while prioritizing value-based care analytics that proactively identify at-risk members for targeted interventions—aiming to reduce avoidable or overpriced medical services and improve outcomes.
The myMarpai mobile app provides members real-time access to plan benefits, cost transparency, deductible tracking, telehealth services, and tailored provider network navigation support—features designed to enhance engagement and adherence to curated care paths.
Additionally, Marpai’s pharmacy benefit management unit leverages coordinated pharmacy-medical benefit integration optimizing specialty drug spend via their PACCS program while negotiating aggressive discounts on out-of-network claims repricing (often up to 60%) providing immediate cost containment benefits for clients and members alike.
This convergence of algorithm-driven decision support with dedicated clinical staff enriches care management optimization beyond typical claims processing firms that remain largely manual or siloed—creating a defensible moat if effectively scaled.
Customer Base Concentration and Sales Channel Dynamics
Marpai’s clientele is concentrated among a limited number of self-insured employers predominantly within the small-to-medium enterprise (SME) sector as well as local government entities—segments increasingly adopting self-funding models due to rising insurance costs and desire for margin recapture from conventional insurers [S2], [S12].
Despite this opportunity set being large (with U.S. private health insurance spending reaching $1.6 trillion in 2024 per CMS), significant revenue volatility emanates from concentrated accounts; two customers accounted for approximately 30% of accounts receivable at end-2024 but less so by late-2025 due to churn and contract renegotiations reducing concentration somewhat but elevating attrition risk overall [S2], [S13].
Sales efforts rely heavily on healthcare benefits brokers who act as primary intermediaries between Marpai and prospective employer clients but often lack exclusive loyalty or incentives aligned strictly to Marpai’s technology value proposition—complicating pipeline predictability and elongating sales cycles substantially due to broker allegiance shifts or employer hesitation toward newer tech-enabled TPAs versus incumbents like Aetna or Cigna who enjoy entrenched relationships [S2], [S18].
This broker dependency coupled with a high customer churn rate (~28% attrition in FY2025) presents an ongoing operational challenge that caps revenue growth absent robust retention strategies or broader channel diversification.
Operating Challenges and Liquidity Risks
Marpai’s disclosures highlight its precarious liquidity position: an accumulated deficit exceeding $115 million as of December 31, 2025 alongside negative working capital around $15 million with scant cash reserves ($133k) available at fiscal year-end—signaling an acute cash burn profile necessitating urgent capital infusions or operational scale-back absent external funding [F1], [S14].
Management acknowledges these challenges explicitly via an explanatory paragraph from their independent auditor noting substantial doubt about continued operation as a going concern beyond twelve months without additional capital raising or asset monetization.
Legal exposures compound liquidity strain including recent settlement agreements stemming from litigation over lease disputes involving multi-million dollar claims settled on relatively modest terms early 2026; concurrently investigations by CMS into potential HIPAA non-compliance related to clearinghouse fee structures further cloud regulatory risk profiles subjecting Marpai to possible penalties or contractual impacts pending resolution [S5], [S8].
Together these factors underscore vulnerabilities in operational scale continuity driven by balance sheet strain intertwined with industry regulatory complexity.
Strategic Outlook: Key Indicators to Monitor
Due to ongoing strategic review processes including potential transaction explorations announced recently, explicit forward guidance is unavailable [S2]. Investors should monitor:
- Reduction in client attrition rates demonstrating improved retention,
- Diversification of revenue mix beyond major clients,
- Successful capital raises extending cash runway without excessive dilution,
- Adoption momentum of AI-powered member guidance programs reflected by satisfaction or cost metrics,
- Stability or improvement in broker alignment facilitating smoother sales cycles,
- Resolution or favorable developments on regulatory inquiries including CMS investigations or legal settlements.
These will materially influence operational momentum and market confidence going forward.
Capital Allocation Review and Shareholder Returns
Marpai continues generating negative free cash flow given persistent operating deficits despite improving trends; estimated free cash flow was near -$7.8 million in FY2025 after subtracting capex (~$360k annually) from operating cash flows (-$7.45M), reflecting continued reinvestment needs amid constrained resources [F1].
Return on equity approximates 50.9%, calculated using net income against negative equity values (-$32.6 million equity base at end-FY2025 derived from accumulated deficit effects). This distortion reflects accounting losses rather than sustainable earnings power given historical deficits implying no meaningful distributable returns such as dividends or share buybacks have occurred nor are likely under current circumstances where preserving cash remains paramount.
Capital allocation focuses currently on survival including funding product development anchored around deep learning enhancements plus defraying legal/regulatory contingencies rather than shareholder distributions.
Regulatory Compliance Terrain and Litigation Impact
Operating within a highly regulated healthcare environment creates multifaceted legal exposures including HIPAA privacy standards governing protected health information usage coupled with scrutiny over fee arrangements that triggered CMS’s ongoing investigation into clearinghouse EFT fees potentially violating HIPAA rules under regulation 45 CFR §162.923(a)—an industry-wide probe impacting multiple TPA players presenting reputational risk nonetheless [S5], [S8].
Additional layers involve federal Anti-Kickback Statutes forbidding inducements related to referrals among Medicare/Medicaid beneficiaries along with complex Stark Law restrictions limiting physician self-referral scenarios imposing hurdles on contracting practices requiring careful navigation lest false claims act exposure arises triggering civil penalties reaching thousands per claim plus treble damages elevating risk profiles considerably if compliance lapses occur or are alleged litigiously.
State-level regulations further vary widely encompassing professional licensing stipulations for clinical personnel alongside managed care contracting license requirements increasing administrative overhead burdens especially when expanding service footprints quickly.[S10], [S16]
Recent settlement of Messer Financial Group litigation regarding lease breach marks completion of one material dispute phase though minor legal engagements persist typical of dynamic TPA operations where member grievances and indemnity claims routinely arise impacting management bandwidth if not financial severity directly.[S8]
This report synthesizes information based solely on public financial filings ([F1]), SEC disclosures ([S#]), and verified news sources ([N#]). It refrains from investment recommendations focusing strictly on factual analysis pertinent to institutional buy-side audience assessment of Marpai’s corporate performance context and operational risks inherent within its innovative yet financially strained business model.
Disclaimer: This is research-only, informational analysis and not investment advice. It may include AI-generated interpretation and general industry context. Always verify important details using primary sources.
Comments