
ACV Auctions' Revenue Surge Highlights Path to Marketplace Profitability
Rapid top-line growth and expanding network effects fuel ACV's digital wholesale vehicle marketplace, though operating losses remain a key challenge.
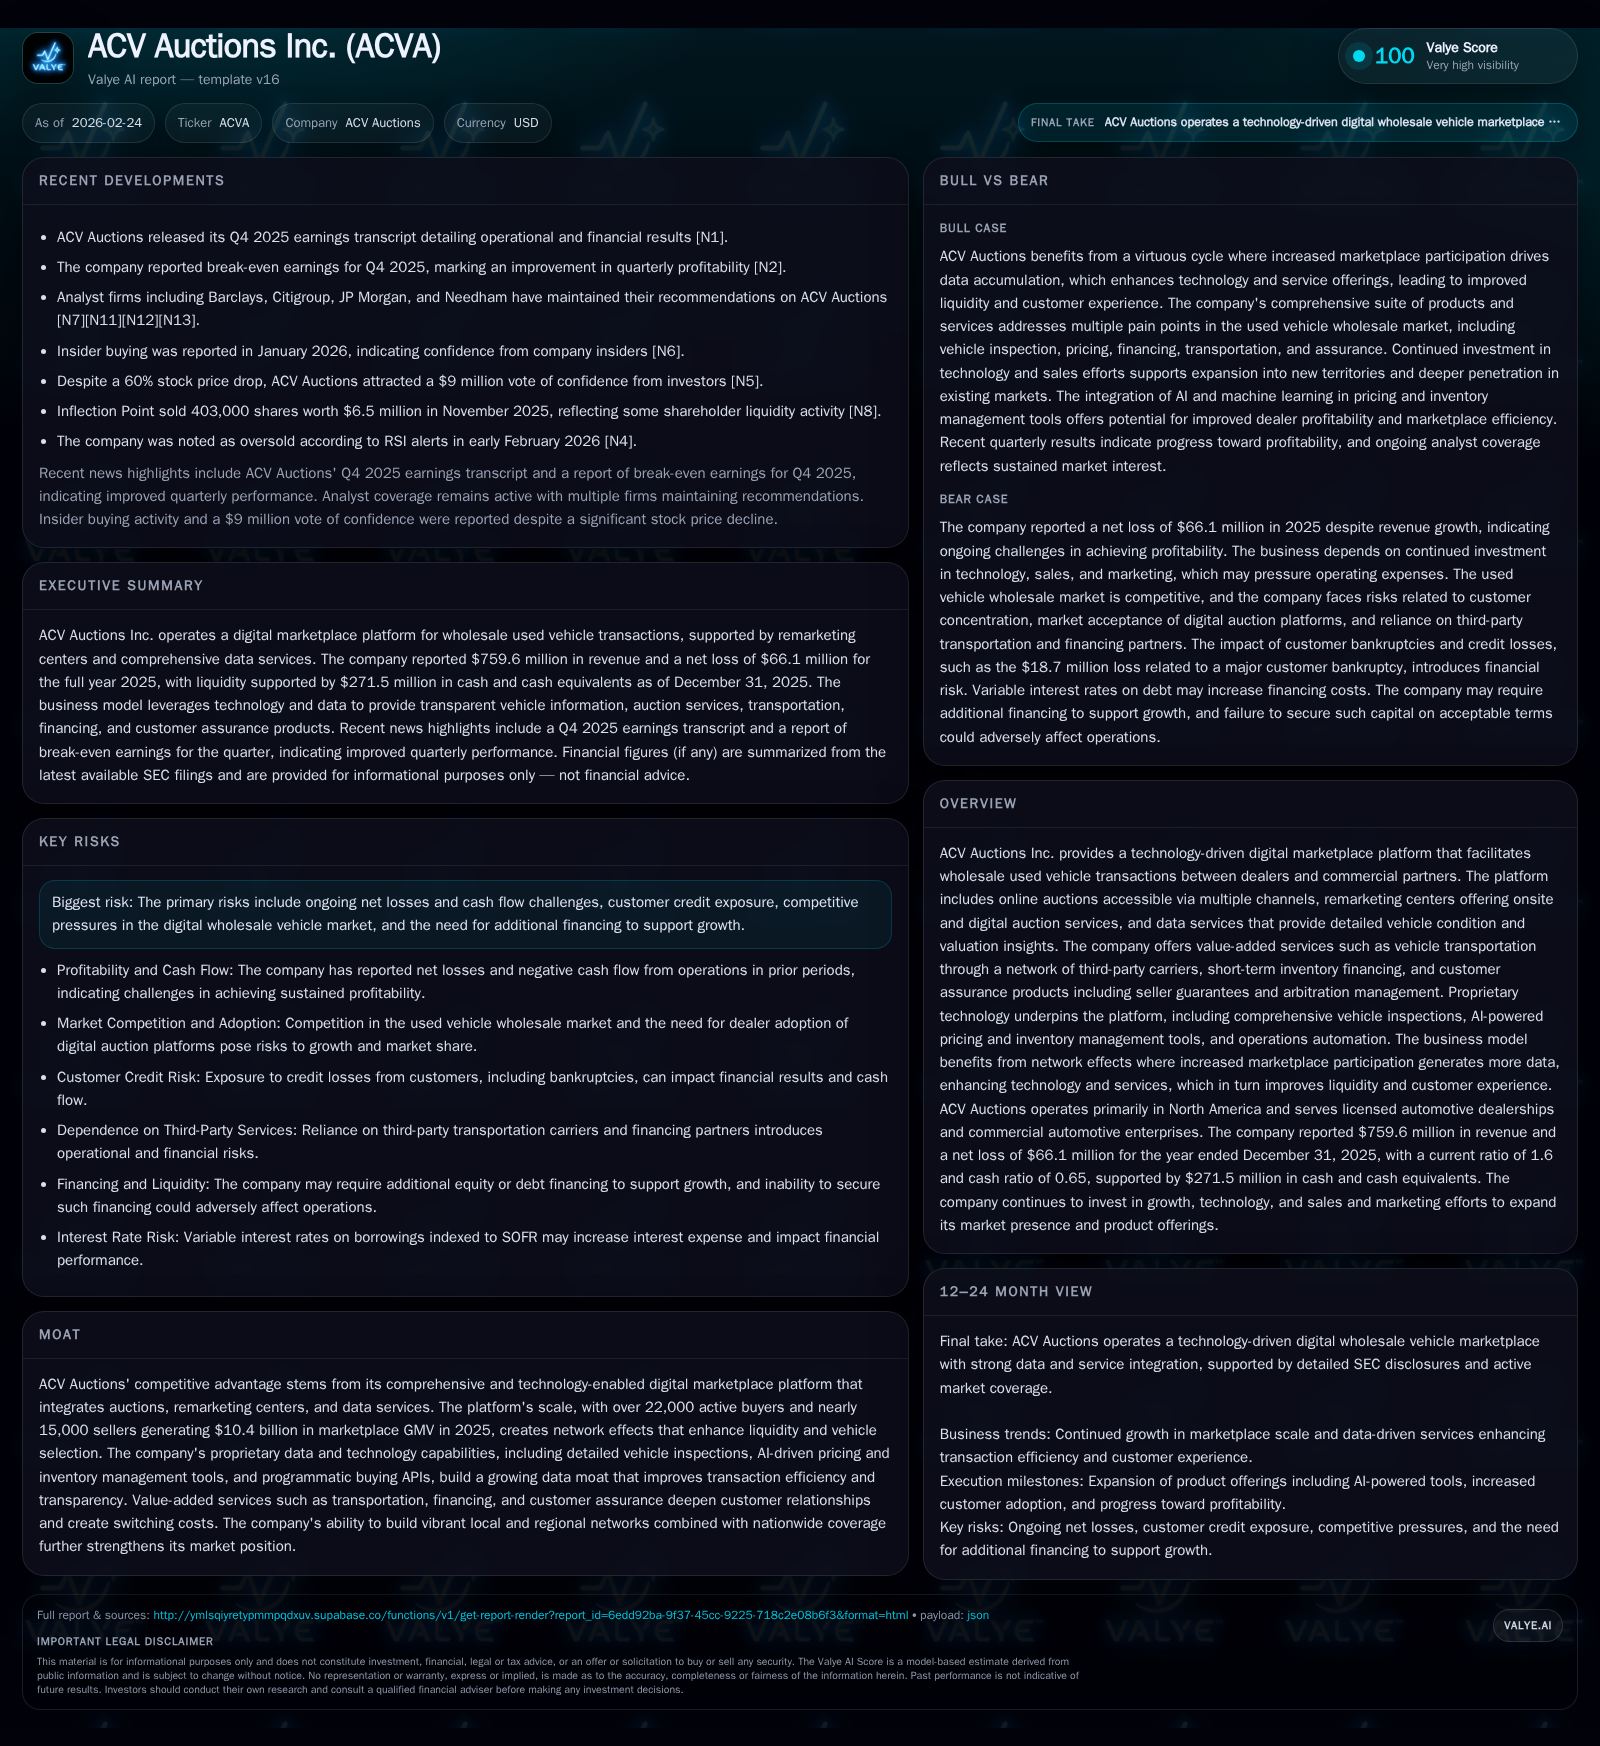
ACV Auctions Inc. demonstrated strong revenue growth of 19.2% in FY2025 on the back of over $10 billion in marketplace GMV, driven by increasing dealer adoption and technology-enabled services. Despite operational improvements leading to a shrinking operating loss, the company continues to post net losses and requires careful capital management amid ongoing investment. With expanded liquidity facilities and positive cash flow from operations, ACV is positioned for further marketplace scaling but must navigate credit exposures and competitive headwinds.
Strong Revenue Growth Fueled by Network Effects and Data-Driven Marketplace
In fiscal year 2025, ACV Auctions Inc. reported revenue of approximately $759.6 million, representing a robust 19.2% increase over the $637.2 million generated in 2024 [F1]. This surge was powered by an active marketplace comprising 22,062 buyers and 14,905 sellers that collectively transacted vehicles totaling $10.4 billion Gross Merchandise Volume (GMV). The dealer base expansion and increased transaction volumes are manifestations of powerful network effects intrinsic to ACV's platform: as more participants join, liquidity deepens and vehicle selection widens—both critical drivers in wholesale vehicle marketplaces [S1].
This digital transformation of wholesale used vehicles replaces traditional physical auctions with online auctions accessible across multiple interfaces including mobile apps and APIs that support programmatic buying [S12]. The growing scale enhances data accumulation enabling more precise pricing models and inventory optimization techniques.
Historical performance (annual)
| FY | Rev ($mm) | Net ($mm) | CFO ($mm) | OpInc ($mm) | Rev YoY | Net YoY |
|---|---|---|---|---|---|---|
| 2025 | 760 | -66 | 78 | -63 | +19.2% | +17.0% |
| 2024 | 637 | -80 | 65 | -84 | +32.4% | -5.9% |
| 2023 | 481 | -75 | -18 | -90 | +14.2% | +26.4% |
| 2022 | 422 | -102 | -75 | -106 |
Note: Omitted columns lack sufficient annual XBRL coverage in the provided tags (need ≥2 annual points): Capex, Div, Buybacks. Source: SEC companyfacts cache [F1].
Capital returns and efficiency (annual)
| FY | FCF ($mm) | ROE% |
|---|---|---|
| 2025 | 69 | -15.4 |
| 2024 | 61 | -18.1 |
| 2023 | -20 | -16.5 |
| 2022 | -78 | 21.0 |
Source: SEC companyfacts cache [F1].
Note: Buybacks and dividends omitted due to unavailable data.
Marketplace Evolution: Technology-Enabled Services Powering Dealer Adoption
ACV's ecosystem extends well beyond pure auction facilitation through a seamless suite of integrated services designed to optimize inventory turn rates and improve transaction velocity [S12]. These services encompass:
Online Auctions: Core offering enabling real-time wholesale transactions accessible through user-friendly web/mobile channels supported by programmatic buying APIs that accelerate bidding via automated workflows.
Remarketing Centers: Physical locations providing onsite auction capabilities which supplement digital channels—facilitating hybrid listing options beneficial for dealers preferring tactile inspection combined with digital reach.
AI-Powered Pricing Tools: Leveraging comprehensive vehicle condition reports—termed "condition report fees"—which underpin transparent pricing strategies helping dealers set market-aligned expectations that minimize downstream arbitration risks.
Transportation Services: Through ACV Transportation LLC’s network of third-party carriers with real-time freight quote integration on checkout pages mitigating delivery friction points.
Floorplan Financing: Short-term inventory financing ("floorplan loans") provided by ACV Capital LLC supports buyer liquidity needs with transparent pricing sans hidden fees—a crucial service supporting efficient dealer cash cycle management.
These multifaceted offerings increase stickiness; dealers experience reduced operational complexity via end-to-end automation—from inspection scheduling to payment processing—boosting platform loyalty and creating defensible switching costs within territorial markets [S18].
Profitability Trajectory: Shrinking Operating Losses Amid Growing Scale
ACV continues its growth-stage trajectory marked by consistent narrowing of operating losses aligned with revenue scale benefits [F1]. Operating income improved from a loss of $84.1 million in FY2024 to a smaller loss of $63.2 million in FY2025—a near ~25% decrease year-over-year despite significant top-line growth reflecting incremental operating leverage.
Net income followed suit with contraction of net losses from $79.7 million down to $66.1 million between these periods [F1], corresponding roughly to a negative return on equity estimated at -15.4% when juxtaposed against year-end shareholder equity of approximately $429.7 million [F1]. The sustained negative ROE captures margin pressure typical for comprehensive marketplaces where upfront tech investment dampens near-term profits but positions for scalable economics.
Ongoing expenses include substantial investment in sales & marketing alongside continued R&D efforts embedding AI/ML technologies into data services powering predictive vehicle valuations and inventory management systems.
Cash Flow Improvement and Capital Structure: Navigating Debt and Liquidity
A pivotal highlight is the turnaround in cash flow from operations (CFO), advancing from negative $17.9 million in FY2023 to positive $65.4 million in FY2024 and subsequently improving further to $78.2 million in FY2025 [F1]. This favorable shift reflects both enhanced working capital management enabled by faster receivables collection relative to payables plus underlying operational gains.
Capital expenditures doubled year-over-year in FY2025 to approximately $9.1 million invested predominantly into technology infrastructure sustaining platform scalability [F1]. Free cash flow approximates $69 million implying cash generation sufficient to fund incremental growth capex.
Capital structure revisions during the recent reporting periods included an amended revolving credit facility increasing borrowing capacity from $160 million up to $250 million with maturity extended through June 2030 [S4][S5]. This amended revolver incorporates staged leverage ratio covenants effective post-2027 designed for greater capital flexibility alongside favorable interest rate resets based on SOFR or base rate plus margins.
Additionally, the Warehouse Facility dedicated for auto floorplan loans was amended extending its revolving feature commitment limit from $125 million to $200 million facilitating expanded financing breadth for buyer customers [S6][S10]. At fiscal year-end latest borrowings under this warehouse facility stood at about $120 million bearing mid-single digit interest rates enhancing financial agility.
Growth Drivers and Risks: Financing, Competition, and Credit Exposure
Looking forward, ACV’s expansion hinges on deepening penetration within existing markets while onboarding new dealerships attracted by comprehensive product suites combining auction liquidity with data-driven insight platforms [S13][S20]. Enhancements such as ClearCar’s AI-powered trade-in tools exemplify ongoing product innovation targeting whole lifecycle vehicle management both wholesale and retail spheres.
Risks entrenched in the business are multifaceted including ongoing operating losses necessitating additional capital raises if cash flows plateau or decelerate—an inherent hurdle for digital marketplaces scaling via heavy upfront investment [S15].
Credit exposure remains salient particularly evidencing losses connected with Tricolor bankruptcy events amounting to approximately $18.7 million recorded as non-recurring expense yet illustrating potential volatility tied to customer finance receivables [S19]. Competitive pressures also intensify as incumbents like Copart pursue augmented tech solutions challenging ACV’s market share—a dynamic warranting close attention per recent earnings reports highlighting Copart missing expectations [N3].
Equity investor sentiment has been volatile with large stock price drawdowns amid oversold technical setups yet receiving intermittent confidence injections via insider buying episodes signaling insider optimism despite external headwinds [N4][N5][N6].
Future Milestones: What To Monitor in Marketplace Expansion and Financial Health
Absent granular forward guidance from management [N1][N2], investors should monitor key milestones including:
- Auction unit volume growth rates versus historical averages reflecting market adoption curves,
- Further contraction of operating losses towards breakeven driven by operational efficiencies,
- Adherence and progression through proposed credit covenants under recently amended Revolver terms,
- Expansion trajectory of value-added service attach rates such as transportation logistics financing penetration,
- Adoption metrics around AI/ML-powered tools influencing average revenue per user,
- Continued strengthening of cash flow conversion ratios sustaining reinvestment capacity.
Each represents integral metrics indicative of maturation towards sustainable profitability within this nascent wholesale used vehicle auction sector where data transparency and end-to-end service integration confer competitive moats.[N1][N2]
Capital Allocation Review: Absence of Dividends or Buybacks Reflects Growth Focus
Reflective of its growth orientation stage, ACV Auctions has not declared dividends nor executed any share repurchase programs as per available disclosures [F1]. Instead capital allocation strategy prioritizes reinvestment into technology development evidenced by doubling capex spend year-over-year complemented by increased operating cash flows funding sales & marketing expansion necessary for dealer acquisition synergy.
This 'growth over yield' philosophy aligns with common marketplace playbooks wherein initial periods emphasize ecosystem buildout before returning capital directly to shareholders. As scale benefits accrue evidenced by narrowing losses paired with positive free cash flow generation dynamics emerge clearer pathways towards shareholder distribution options longer term.
Sources referenced herein include SEC filings dated February 23, 2026 ([S1]-[S29]), latest companyfacts financial XBRL datasets ([F1]), Nasdaq earnings transcripts ([N1],[N2]), relevant industry news articles ([N3]-[N6]), consistent with Valye News citation policy.
Disclaimer: This analysis is provided solely for informational purposes based on publicly available information as of February 24, 2026; it does not constitute investment advice or recommendations.
Disclaimer: This is research-only, informational analysis and not investment advice. It may include AI-generated interpretation and general industry context. Always verify important details using primary sources.
Comments