
BCB Bancorp’s Return Challenge: From Solid Growth to a Sharp Loss in 2025
BCB Bancorp shifted from multi-year earnings growth into a significant net loss in 2025, spotlighting capital strategy and operational risks.
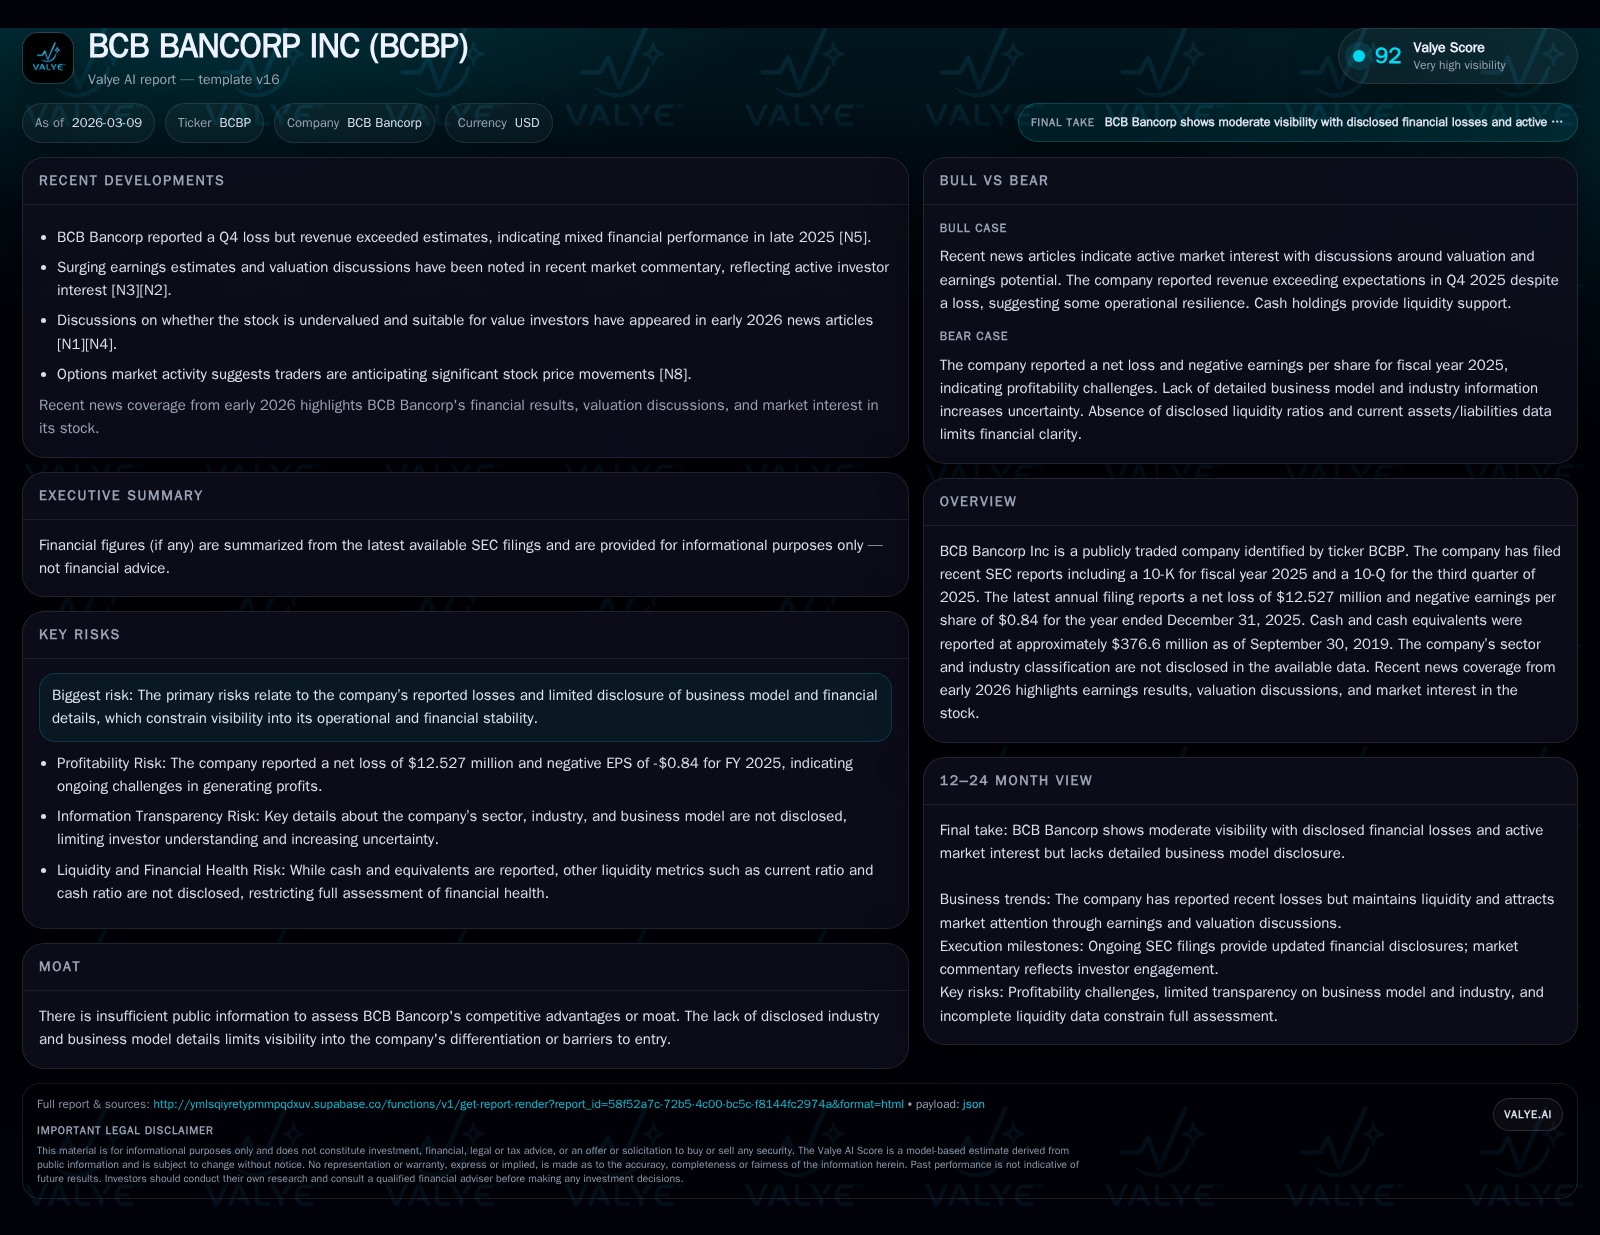
After steady net income growth from 2022 through 2024, BCB Bancorp experienced a sharp reversal in 2025 with a $12.5 million net loss. Despite profitability challenges, operating cash flow remained positive at $35.9 million, supporting free cash flow after capex. The company’s liquidity profile shows adjustments in deposits and Federal Home Loan Bank advances during 2025, while capital allocation included sustained dividends and modest share repurchases. Market narratives highlight rising forward earnings estimates amid valuation uncertainties and limited disclosure.
Historical Financial Performance
Historical performance (annual)
| FY | Net ($mm) | CFO ($mm) | Capex ($mm) | Net YoY |
|---|---|---|---|---|
| 2025 | -13 | 36 | 1 | -167.3% |
| 2024 | 19 | 68 | 1 | -36.8% |
| 2023 | 29 | 35 | 5 | -35.3% |
| 2022 | 46 | 41 | 1 |
Source: SEC companyfacts cache [F1].
Capital returns and efficiency (annual)
| FY | Div ($mm) | Buybacks ($mm) | FCF ($mm) |
|---|---|---|---|
| 2025 | 11 | 4 | 35 |
| 2024 | 10 | 4 | 67 |
| 2023 | 10 | 4 | 31 |
| 2022 | 10 | 3 | 40 |
Source: SEC companyfacts cache [F1].
BCB Bancorp demonstrated a downward trend in net income from a peak of approximately $45.6 million in fiscal year (FY) 2022 to $29.5 million in FY 2023 and further down to $18.6 million in FY 2024 before experiencing a net loss of $12.5 million in FY 2025 [F1]. Despite this decline, operating cash flow remained positive throughout these periods, registering $40.9 million in FY 2022, dipping to $35.2 million for the trailing twelve months ending FY 2023, then peaking at $67.7 million in FY 2024 before falling sharply to $35.9 million in FY 2025 [F1]. Capital expenditures were modest relative to operating cash flows, averaging between approximately $0.5 million and $4.5 million annually over the same period, with FY 2025 capex at roughly $1.0 million [F1].
The common equity base grew from about $291 million at end-2022 to nearly $324 million at end-2024 before slightly contracting to around $304 million at the end of FY 2025 [F1]. This resulted in a negative return on equity (ROE) of approximately -4.1% for FY 2025 based on reported net income relative to total equity [F1].
Operational Challenges and Market Response in 2025
Fiscal year 2025 marked a significant earnings setback with a net loss driven largely by increased loan loss provisions and elevated non-interest expenses as revealed by Q4 results that nonetheless beat revenue expectations [N2][S1]. The bank's strategic segmentation of its loan portfolio now includes cannabis-related loans as a distinct category due to their unique risk profile, reflecting heightened credit risk considerations [S13]. Rising allowance for credit losses against loans is likely a contributing factor to the reported losses.
Market commentary following the Q4 release indicates surging forward earnings per share (EPS) estimates suggesting investor optimism regarding operational recovery prospects or improved credit quality; however, valuation remains complicated due to limited transparency regarding segment details and risk exposures [N1][N3].
Liquidity Position and Capital Structure
Throughout FY 2025, BCB Bancorp maintained substantial liquidity with total deposits increasing modestly from about $2.69 billion midyear to approximately $2.75 billion by September quarter-end [S5][S6]. Non-interest-bearing deposits constituted roughly one-fifth of total deposits (~$537 million versus ~$2.15 billion interest-bearing), affecting funding cost dynamics critical for net interest margin management.
Federal Home Loan Bank (FHLB) advances showed notable variation within the year—from around $335 million mid-2025 up to about $455 million by September—indicating reliance on wholesale funding sources alongside deposit balances [S4][S6]. Subordinated debentures remained stable near $43 million during this period, while preferred stock issuances were inactive [S5][S26]. Cash and equivalents declined somewhat relative to prior periods (~$249 million vs ~$317 million earlier), possibly reflecting asset deployment toward loans or investments.
Capital Allocation: Dividends and Buybacks
Despite the net loss recorded in FY25, BCB Bancorp sustained dividend payments totaling approximately $10.6 million—consistent with prior years' distributions near the same level—underscoring management’s commitment to shareholder returns amid challenging earnings conditions [F1]. Share repurchase activity historically stood near $3.8 million annually through FY23; however, no clear buyback data is available for FY25 [F1]. Maintaining dividends amidst losses may raise questions about payout sustainability absent evident earnings recovery.
Outlook Considerations
Investors should monitor upcoming quarterly disclosures for indications of stabilization or improvement across key metrics such as loan delinquency trends—particularly within specialized portfolios like cannabis loans—net interest margin behavior amid funding cost shifts, and expense management effectiveness.
Recent governance changes include the appointment of Gerald Werdann as director effective March 1, 2026, which could influence strategic oversight priorities going forward [S3].
Risk Factors and Disclosure Limitations
BCB Bancorp's public disclosures provide limited detail on business segments beyond its primary commercial banking operations across New Jersey and New York markets [S1][S22]. The identified risk factors emphasize vulnerability to credit quality deterioration and regulatory challenges inherent to its geographic footprint.
The separate identification of cannabis-related lending underscores evolving risk complexities given federal regulatory uncertainty surrounding this niche sector [S13]. These layered risks may continue impacting financial results if adverse economic or market conditions persist.
Disclaimer: This analysis compiles publicly available financial filings and news reports without provision of investment advice or recommendations.
Disclaimer: This is research-only, informational analysis and not investment advice. It may include AI-generated interpretation and general industry context. Always verify important details using primary sources.
Comments