
Saul Centers’ Concentrated Growth Strategy and Capital Structure Emphasize Grocery-Anchored Anchors in Washington, DC/Baltimore
Focused on transit-oriented development and stable grocery-anchored centers, Saul Centers balances steady operating income with elevated capital expenditures and conservative leverage.
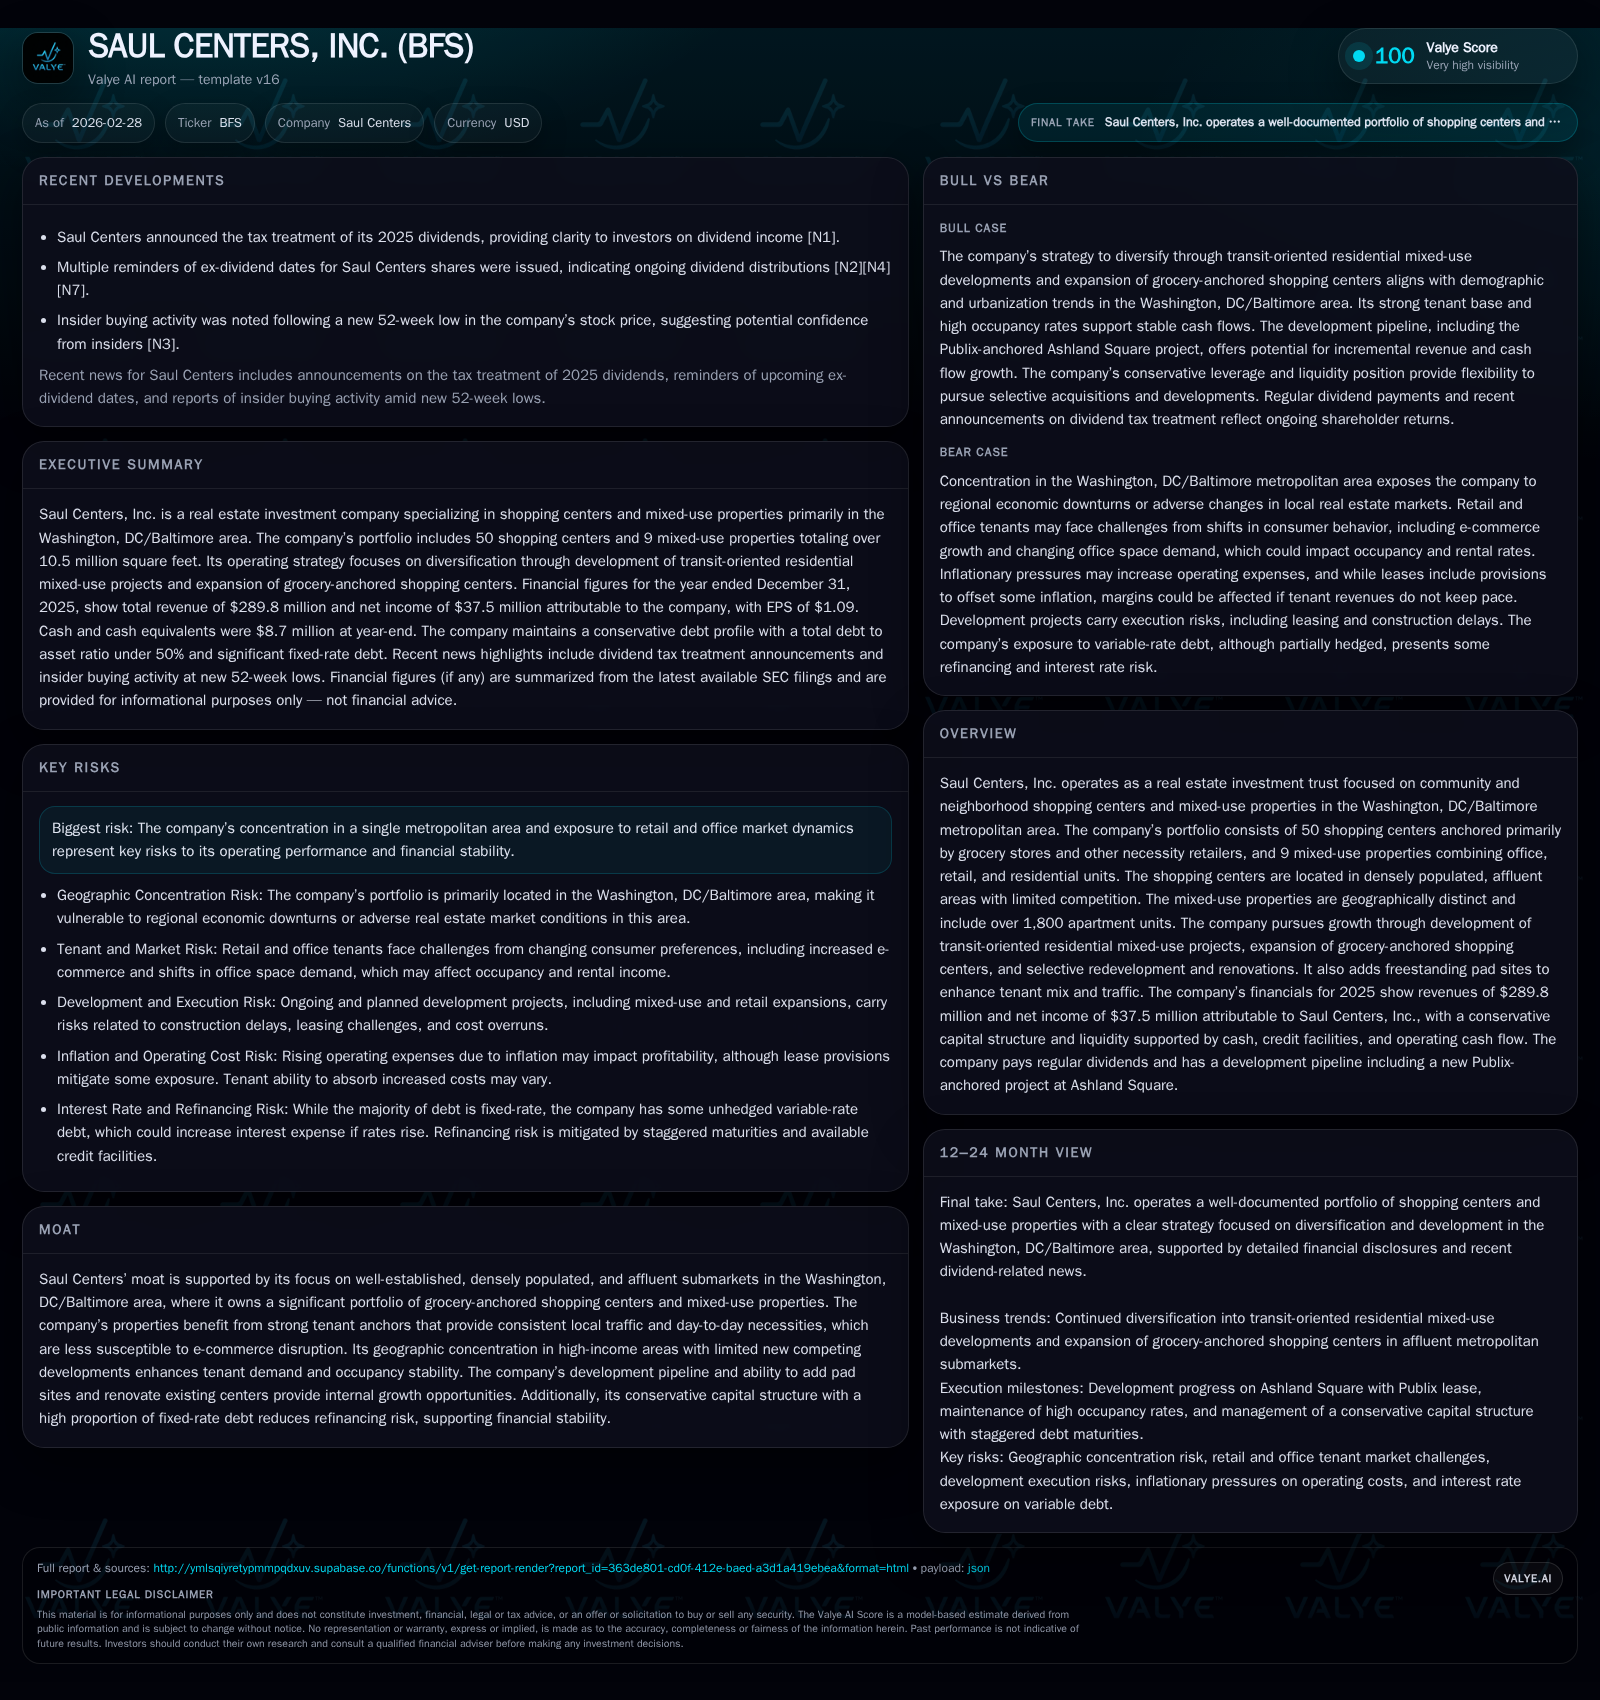
Saul Centers, Inc. operates primarily community and neighborhood shopping centers with grocery anchors and mixed-use properties in affluent, densely populated submarkets around Washington, DC and Baltimore. Revenue rose nearly 8% in 2025 to $289.8 million, driven by portfolio expansion and leasing activity, although operating income declined 4.1% due to elevated expenses. The company’s strategy prioritizes transit-oriented residential development and selective redevelopment, leveraging a strong local footprint and tenant anchor stability. Despite solid operating cash flows, large capital expenditures have resulted in negative free cash flow recently. Saul Centers maintains a conservative balance sheet with fixed-rate debt covering the bulk of borrowings and modest available revolver capacity.
Historical Financial Performance
Saul Centers has demonstrated consistent revenue growth supported by its focused strategy on grocery-anchored shopping centers and mixed-use developments within the Washington DC/Baltimore region [F1][S1]. Total revenues increased from $245.9 million in 2022 to $289.8 million in 2025, reflecting successful asset expansion and leasing activities.
Operating income peaked at $203.8 million in 2024 before declining slightly to $195.3 million in 2025 due principally to higher maintenance expenses and redevelopment investments [F1][S1]. Net income declined more sharply to $37.5 million in 2025 from $50.6 million the prior year, impacted by increased interest costs and depreciation charges [F1]. This corresponds to an approximate return on equity of about 12.2%, based on equity of approximately $308 million at year-end [F1].
Operating cash flow decreased from $121.2 million in 2024 to about $100 million in 2025 while capital expenditures nearly doubled year-over-year, underscoring heightened investment activity in redevelopment and expansion projects [F1][S1]. As a result, free cash flow turned negative by roughly $17 million.
Historical performance (annual)
| FY | Rev ($mm) | Net ($mm) | CFO ($mm) | OpInc ($mm) | Rev YoY | Net YoY |
|---|---|---|---|---|---|---|
| 2025 | 290 | 38 | 100 | 195 | +7.8% | -25.9% |
| 2024 | 269 | 51 | 121 | 204 | +4.5% | -3.9% |
| 2023 | 257 | 53 | 118 | +4.6% | +5.0% | |
| 2022 | 246 | 50 | 121 |
Source: SEC companyfacts cache [F1].
Capital returns and efficiency (annual)
| FY | Div ($mm) | ROE% |
|---|---|---|
| 2025 | 57 | 12.2 |
| 2024 | 57 | 15.1 |
| 2023 | 57 | 15.1 |
| 2022 | 56 | 12.5 |
Source: SEC companyfacts cache [F1].
Note: Capital expenditures for recent years are approximated based on SEC narratives where explicit figures are unavailable.
Portfolio Composition and Strategic Focus
Saul Centers’ competitive advantage stems from its geographic concentration within affluent Washington DC/Baltimore metropolitan areas where average household incomes around its shopping centers exceed $150,000 within a three-mile radius—well above national averages [S1][N1]. This demographic supports steady demand for necessity-driven retail anchored primarily by grocery stores that generate consistent foot traffic resilient to online substitution.
The core portfolio consists of approximately fifty seasoned community and neighborhood shopping centers averaging roughly156,300 square feet each alongside nine mixed-use properties comprising over1,800 residential units combined with office and retail components [S1][S12]. Lease expirations are staggered across the next decade with renewal rates supporting occupancy stability at approximately94.6% as of December31,2025 [S1].
Growth initiatives focus on transit-oriented residential mixed-use developments proximate to Metro stations predominantly within Montgomery County [S1]. Projects such as Twinbrook Quarter Phase I integrate residential apartments with an anchor Wegmans supermarket while deferring office tower construction amid current market conditions [S1]. The Ashland Square development adds a Publix grocery store anchoring about124,000 square feet of retail space enhancing tenant mix.
Additionally, eight freestanding pad sites have been either executed or are under negotiation as part of efforts to increase traffic generators with popular retailers [S1]. Redevelopment projects aim to modernize existing shopping centers for competitive positioning.
Capital Structure and Liquidity Position
Management maintains a prudent target ratio of total debt to total estimated asset value at or below50%, aligning with a conservative financial approach that preserves flexibility for growth financing without excessive leverage risk [S4][S7][S10]. As of December31,2025, total debt approximated$1.63 billion including roughly$189 million variable-rate borrowings under the expanded$600 million credit facility—up from$525 million midyear [S4][S7][S9].
Fixed-rate debt accounted for approximately88% of notes payable as of year-end, mitigating exposure to interest rate fluctuations aided by interest rate swaps hedging$100 million of variable-rate debt at SOFR levels near3% [S4][S6][S21]. Debt maturities are well staggered through2041 with balloon payments concentrated beyond five years supporting refinancing flexibility [S19].
Liquidity remains robust with nearly$96 million available under revolving credit facilities at year-end complemented by over$8 million in cash equivalents [S4][F1]. Compliance with financial covenants was maintained throughout the period reinforcing access to capital markets for opportunistic acquisitions or development funding.
Capital Allocation: Distributions & Equity Issuance
As a REIT, Saul Centers consistently pays quarterly dividends reflecting regulatory requirements mandating distribution of at least90% of taxable income while balancing reinvestment needs [S11][N1]. Total dividends paid were approximately$57 million in2025 consistent with prior years despite fluctuations in net earnings.
Dividend Reinvestment Plans (DRIPs) contribute common stock issuance annually by tens of thousands of shares/unit equivalents which support incremental investment funding while moderating dilution [S11][S13][S16]. No material share repurchase programs were reported; capital return emphasis remains on dividends.
Future Growth Prospects and Risks
Future growth depends heavily on successful execution of transit-oriented multifamily housing projects along with expansions of grocery-anchored shopping centers within supply-constrained submarkets exhibiting favorable supply-demand dynamics [S1]. Redevelopment efforts targeting enhanced tenant mixes offer potential internal NOI growth.
Risks include geographic concentration given sole focus on metro Washington DC/Baltimore markets exposing the company to localized economic or regulatory changes impacting office and retail property fundamentals [S1][N1]. Broader trends such as increasing e-commerce adoption may continue affecting discretionary tenancy segments though necessity anchors provide some insulation.
Federal policies influencing commuter patterns or government employment levels could impact office demand adjacent to mixed-use holdings necessitating ongoing portfolio optimization.
Monitoring Considerations
Investors should monitor lease renewal trends especially for anchor tenants’ performance metrics; progress on pipeline projects including timing for Twinbrook Quarter's office component; pacing of capital expenditures relative to cash flow generation; refinancing activity amid changing interest rates; occupancy trends post redevelopments; competitive developments locally; as well as evolving zoning or tax regulations.
Conclusion
Saul Centers blends disciplined strategic focus leveraging its moat created through affluent urban-suburban markets combined with grocery anchors ensuring stable customer bases less vulnerable to online retail disruptions prevalent elsewhere in real estate sectors [F1][S1]. Its measured approach balancing development opportunities with financial conservatism offers a combination of income stability alongside selective growth potential dependent on execution success in transit-oriented projects.
This analysis is based solely on publicly available information as of the report date; it does not constitute investment advice or recommendations.
Disclaimer: This is research-only, informational analysis and not investment advice. It may include AI-generated interpretation and general industry context. Always verify important details using primary sources.
Comments