
Brilliant Earth’s Omnichannel Growth Tested by Profitability and Capital Allocation Challenges
Brilliant Earth expands its footprint and fine jewelry assortment while facing margin pressures and evolving capital demands.
Brilliant Earth Group, Inc. has demonstrated consistent top-line growth driven by omnichannel expansion and next-gen consumer appeal but experienced a swing to net losses in 2025 despite positive operating cash flow. Investments in technology, showroom scale, and product portfolio diversification underpin future growth potential, though margin compression and elevated operating costs are key constraints. The company preemptively retired its debt facility to enhance financial flexibility, returning capital modestly through dividends and buybacks amidst a challenging jewelry market environment.
Company Overview
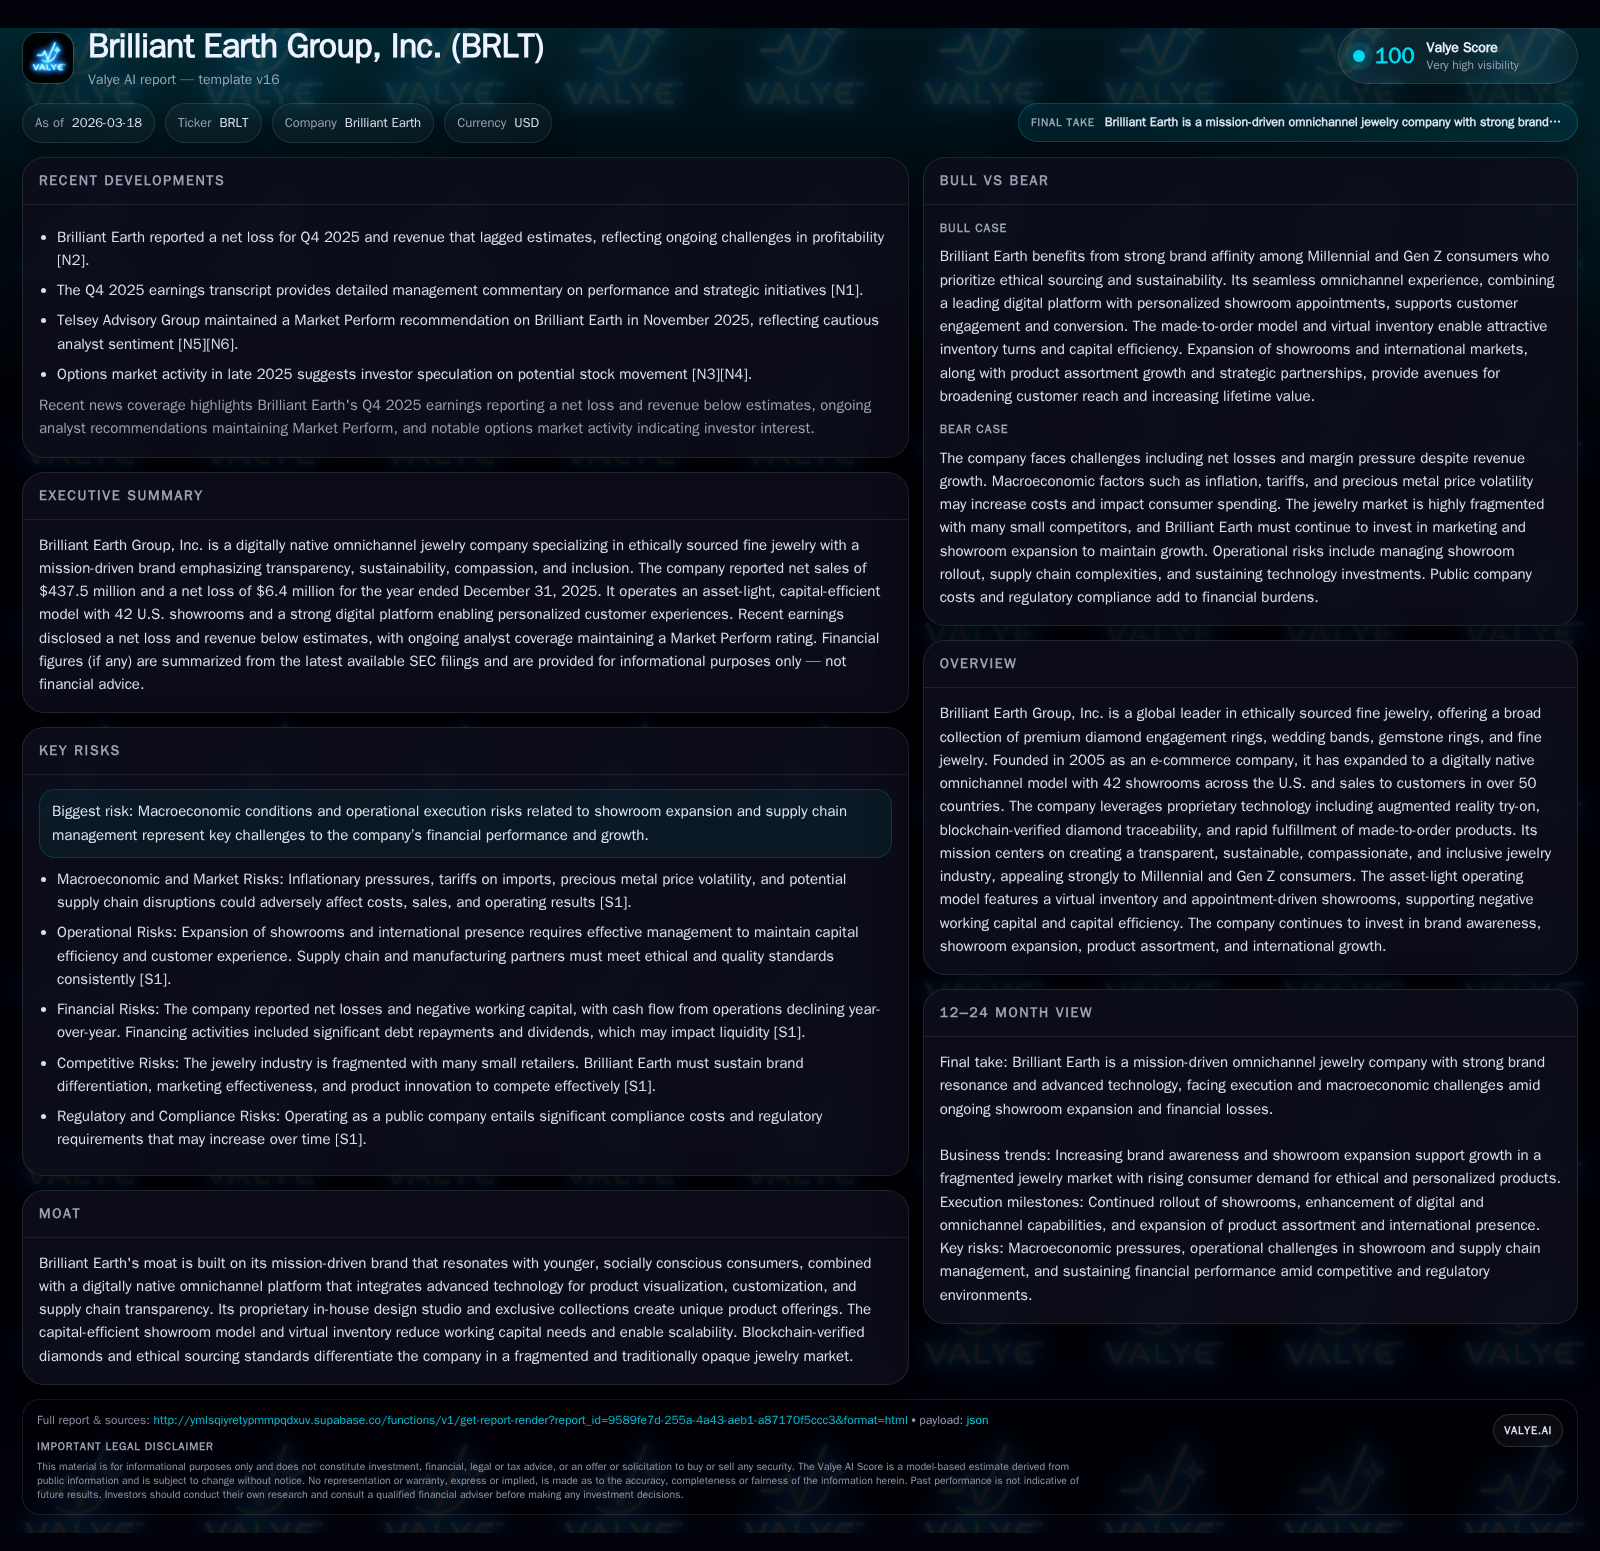
Founded in 2005 as an e-commerce pioneer in ethically sourced fine jewelry, Brilliant Earth Group, Inc. (BRLT) has evolved into a digitally native omnichannel retailer with a strong mission focus on sustainability, transparency, and inclusivity. The company offers premium diamond engagement rings, wedding bands, gemstone rings, and fine jewelry conceptualized through its in-house design studio and fulfilled via expert jewelers.
Its footprint comprises 42 appointment-only showrooms across the U.S., supporting personalized experiences while leveraging advanced digital capabilities such as augmented reality try-on and blockchain-verified diamond traceability that resonate strongly with Millennial and Gen Z consumers [S1]. The virtual inventory model facilitates rapid made-to-order fulfillment while enabling negative working capital dynamics characteristic of its business model.
Historical Performance and Drivers
Brilliant Earth's historical growth has been fueled by expanding brand awareness among socially conscious consumers alongside rapid showroom rollouts paired with technology investments enhancing the customer journey both online and offline.
Historical performance (annual)
| FY | Net ($mm) | CFO ($mm) | OpInc ($mm) | Capex ($mm) | Net YoY |
|---|---|---|---|---|---|
| 2025 | -4 | 10 | -5 | 4 | -771.9% |
| 2024 | 1 | 18 | 3 | 5 | -7.4% |
| 2023 | 1 | 26 | 4 | 12 | -72.6% |
| 2022 | 2 | 15 | 23 | 9 |
Source: SEC companyfacts cache [F1].
Capital returns and efficiency (annual)
| FY | Buybacks ($) | FCF ($mm) | ROE% |
|---|---|---|---|
| 2025 | 456000 | 6 | -29.6 |
| 2024 | 638000 | 13 | 3.5 |
| 2023 | 14 | 4.7 | |
| 2022 | 5 | 19.5 |
Source: SEC companyfacts cache [F1].
Note: Operating income for FY2025 was negative $5.4 million [F1]. Dividends (*) include a one-time special dividend paid in September 2025 totaling approximately $25 million [S10].
Revenue grew modestly by about 3.6% year-over-year to $437.5 million in FY2025, driven by wider adoption of the company's made-to-order "Design Your Own" flagship product enabled by rapid fulfillment technologies [S1][N1]. The United States accounts for approximately $422 million of sales whereas international volumes remain under $16 million [S8], underscoring U.S.-centric expansion.
Profitability deteriorated sharply with the transition into a net loss of $3.6 million from a small profit base the prior year, due primarily to investments in showroom infrastructure (now totaling forty-two locations), marketing to broaden brand recognition, higher cost of sales relating to premium materials, and increased administrative expenses [S1][F1]. Adjusted EBITDA halved to just under $12 million despite revenue growth with the margin tightening to below three percent [S21].
Cash Flows & Capital Allocation
Operating cash flows remained positive at roughly $9.7 million in FY2025 but declined nearly 45% compared to the prior year as earnings turned negative and changes in working capital absorbed more liquidity [F1][S15]. Capital expenditures were contained at about $4 million focused on new showroom developments and technology enhancements — down from nearly $12 million two years prior — reflecting measured expansion [F1][S21]. Free cash flow consequently remained positive at approximately $5.7 million.
A major highlight was the prepayment in August 2025 of all principal outstanding on their Silicon Valley Bank term loan facility (~$34.8 million principal), eliminating associated covenants effective at year-end as well as interest expense obligations going forward [S4][S6][S15]. This move improved the company’s liquidity profile but resulted in a modest loss on debt extinguishment of $0.6 million [S10].
Capital returned to shareholders included a special one-time dividend totalling some $25 million distributed mainly among LLC members alongside a smaller payout to Class A shareholders [S10][S14]. Ongoing quarterly tax distributions totaled approximately $6.8 million aligned with estimated income tax liabilities [S7][S17]. Share repurchases remain minimal at around half a million dollars [F1][S14], signaling conservative buyback activity.
Growth Prospects & Strategic Drivers
Brilliant Earth's core growth strategy hinges on amplifying brand awareness among environmentally conscious younger cohorts who value ethical sourcing paired with cutting-edge digital engagement tools such as augmented reality product visualization and blockchain provenance verification [S1]. The company continues investing heavily in performance marketing campaigns across platforms including social media influencers, email marketing, and earned media placements designed to extend reach efficiently [S1].
The omni-channel approach blending a seamless online experience with educational showroom appointments aims to capture multiple shopping preferences while the bespoke “Design Your Own” process differentiates product offerings beyond commoditized industry standards [S1]. Their asset-light virtual inventory model promotes high inventory turnover rates enabling negative working capital operation typical for digitally native retailers [S1][F1].
Fine jewelry represents an expanding portion of sales domestically with incremental international opportunities available albeit currently under-penetrated given just ~3-4% contribution outside the U.S., indicating potential for geographic scaling over time [S8]. Moreover, reliance on exclusive designs produced internally strengthens pricing power amid fragmented competition marked by opaque supply chains.
Constraints & Risks
The biggest headwinds include macroeconomic pressures that influence discretionary spending — crucial for luxury goods like engagement rings — coupled with operational execution risks posed by aggressive showroom rollouts that increase fixed costs before volume scales sufficiently to cover them [S11][N2]. Supply chain complexities can also impact lead times or material costs given premium ethical sourcing requirements.
Margins are thin relative to top-line size due partially to these investments along with elevated marketing spend needed to maintain brand momentum against competitors aggressively courting Millennial/Gen Z buyers [N1][S1]. While the company boasts innovative tech advantages (blockchain tracking; AR try-on), ongoing R&D efforts impose expense burdens with payoffs likely medium-term rather than immediate [S21].
Litigation exposure related primarily to labor claims remains unresolved but not deemed material presently per disclosures [S16], warranting monitoring.
Outlook & Milestones To Watch (Analysis)
Explicit forward guidance is absent; however key milestones include:
- Continued expansion or optimization of showroom footprint balancing customer acquisition gains against cost control;
- Enhancements or new features integrated into their digital platforms influencing conversion rates;
- Improvement or stabilization of adjusted EBITDA margins indicating leverage of fixed costs through higher sales volumes;
- Execution on increasing international revenues beyond current low base;
- Any future capital allocation decisions such as resumption or scaling of share repurchases or dividends post current special payouts;
- Management’s ability to generate sustained positive net income while maintaining or growing operating cash flow amid competitive pressures.
Capital Structure & Liquidity Summary
As of December end-2025, Brilliant Earth reported ample liquidity with cash balances near $79 million alongside negative working capital approximating $(24) million attributable to its swift inventory turnover model where customer payments precede supplier settlements [F1][S9]. The balance sheet no longer carries long-term debt after full repayment of the SVB term loan but includes lease liabilities weighted over several years reflecting its showroom real estate commitments totaling present value ~$38 million [S18][S22]. Equity stood around $12.3 million after distributions reduced retained earnings during the year [F1][S9].
The elimination of debt reduces fixed financial charges improving earnings volatility buffers though rent expense remains substantial tied to operating lease obligations that require ongoing cash outflows approaching $9-10 million annually currently [S18]. Capital expenditures should be expected around mid-single digit millions per annum reflecting steady showroom refreshes coupled with ongoing tech investments rather than rapid buildout.
Conclusion
Brilliant Earth occupies an attractive niche offering ethically sourced fine jewelry fused with omnichannel digital innovation tailored for younger consumers demanding transparency and sustainability amid luxury purchases — a compelling thematic given evolving values around responsible consumerism.
Financially the company is transitioning through investment phases reflected by revenue growth accompanied by margin pressures and profitability setbacks largely due to expanded physical footprint costs plus marketing intensity needed for brand building.
Their virtuous cycle stems from combining leading-edge AR/digital tools and blockchain provenance within an asset-light inventory framework that supports negative working capital – distinguishing it from legacy jewelry retailers typically burdened by high inventories and opaque sourcing.
Key risks linger around macroeconomic sensitivity inherent in discretionary luxury spending patterns alongside execution risks pertaining showroom rollout pacing balancing customer conversion economics amidst increasingly competitive channels.
Investors will want to monitor operational leverage trends against showroom cost absorption progress plus signs of margin recovery while assessing how continued marketing investments translate into durable brand equity gains driving lifetime customer value over time.
This analysis is based solely on publicly available information as of March 2026 without projection beyond stated facts or non-disclosed company guidance.
Disclaimer: This is research-only, informational analysis and not investment advice. It may include AI-generated interpretation and general industry context. Always verify important details using primary sources.
Comments