
Earnings Surge and Portfolio Diversification Drive Sierra Bancorp’s 2025 Results
Sierra Bancorp experienced a dramatic net income rebound in 2025, underpinned by a diversified loan portfolio and active capital return programs.
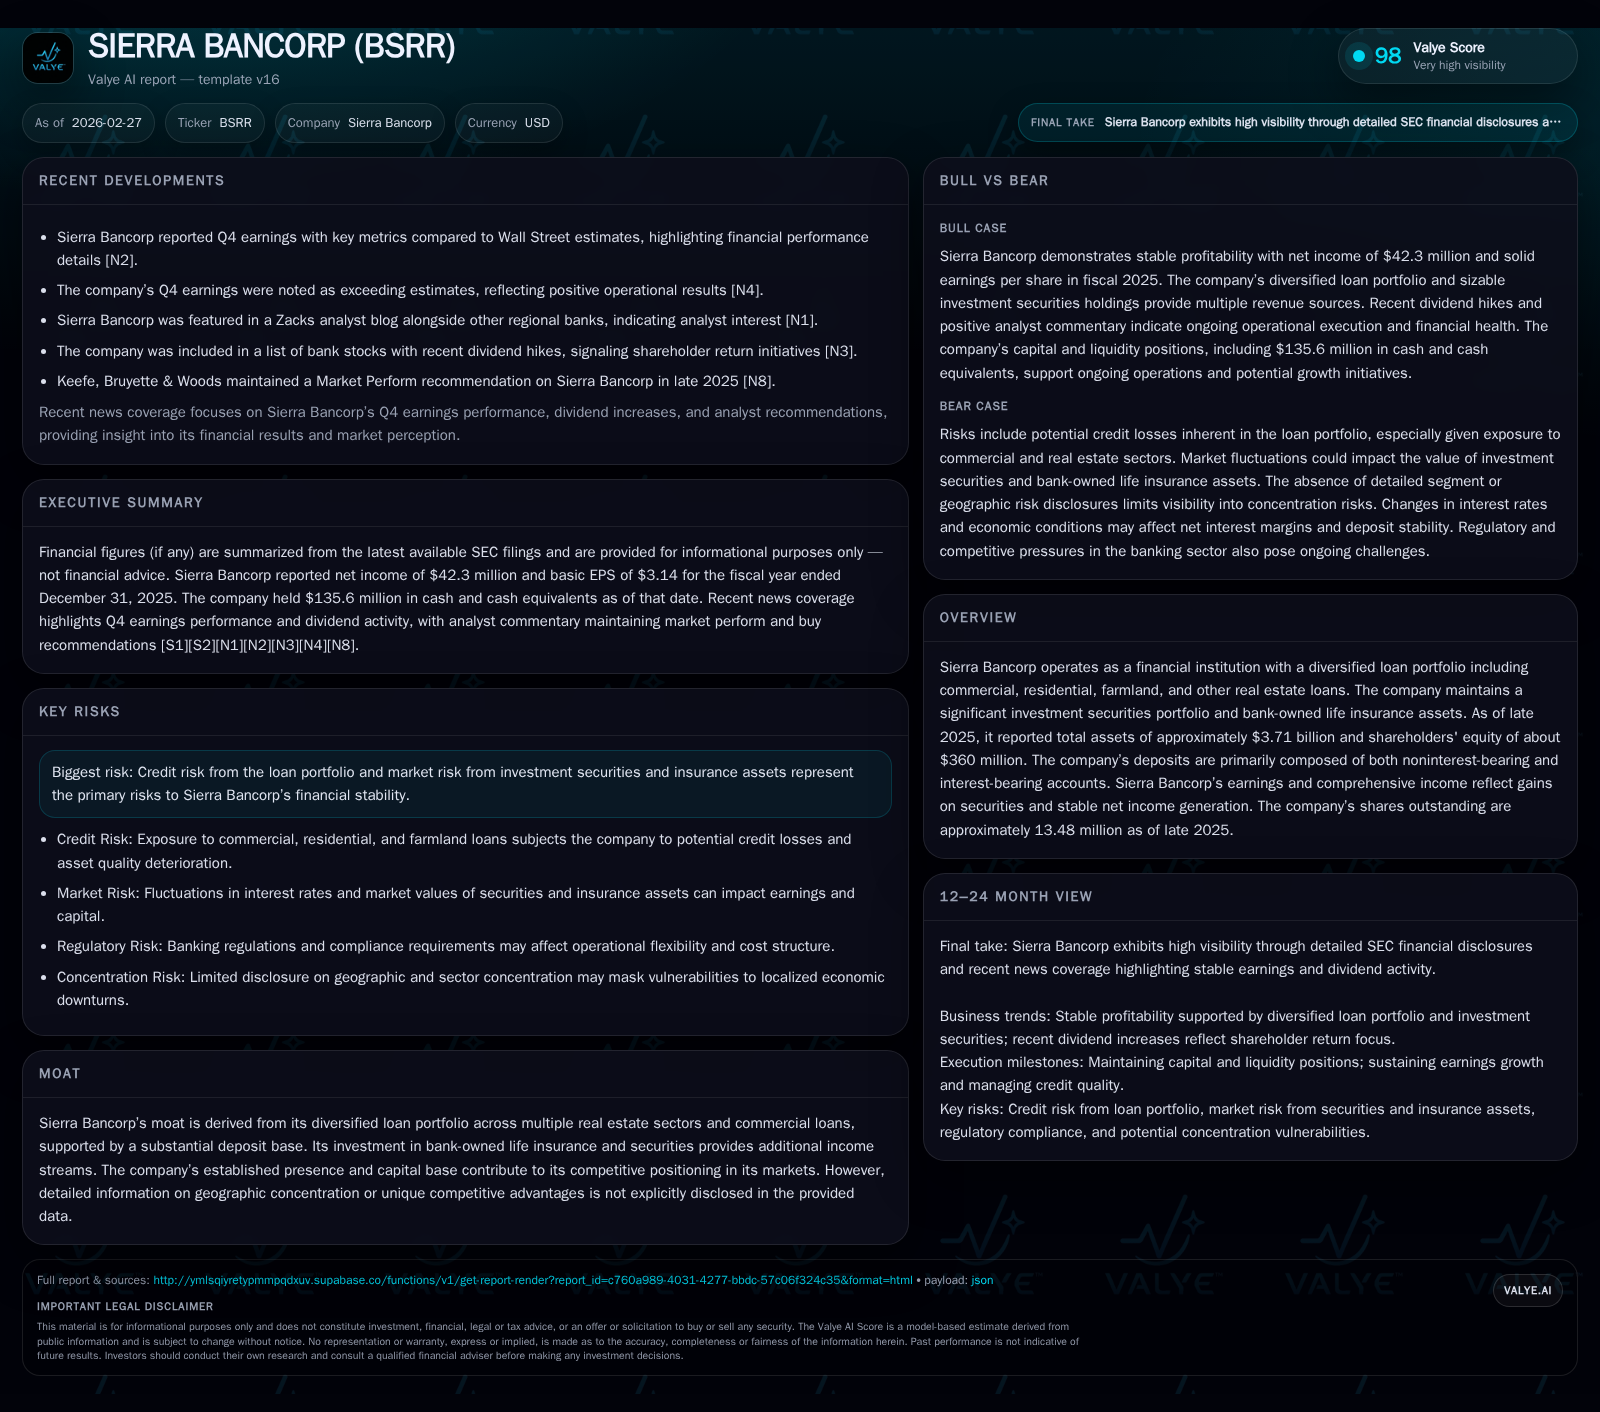
In 2025, Sierra Bancorp posted a robust 308% increase in net income, reaching approximately $42.3 million, driven primarily by improved lending income and gains on securities. Its diversified loan mix across commercial, residential, farmland, and other real estate sectors has provided income stability amid evolving economic conditions. The bank’s capital allocation strategy emphasized significant share repurchases alongside sustaining dividend payments, supporting an approximate return on equity of 11.6%. Investors should watch for trends in deposit growth and credit loss allowances as key indicators of future performance.
A Strong Recovery: Historical Performance and Earnings Drivers
Sierra Bancorp's financial performance underwent a marked turnaround in the fiscal year ending December 31, 2025. Net income reached $42.3 million—more than quadruple the $10.36 million reported in FY2024—resulting in a formidable year-over-year increase of approximately 308% [F1]. This rebound signals effective management execution after relatively modest profits over the prior years: $7.11 million in FY2022 and $6.29 million in FY2023.
While net income gained momentum, operating cash flow (CFO) told a more nuanced story; CFO decreased by roughly 41% year-over-year to $33.7 million in FY2025 from $57.2 million in FY2024 [F1]. This divergence points to changes in non-cash working capital components or timing differences in cash collections versus accrual earnings, common within banking operations managing loan paydowns and security portfolios.
Capital expenditures (capex) moderately increased by about 32.5%, from $1.16 million to $1.53 million [F1], suggesting restrained investing activity consistent with typical banking needs for premises or technology updates rather than expansion capex.
The shareholders’ equity base grew steadily from $303.6 million in FY2022 to $364.9 million by end-2025 [F1], providing a solid capital foundation supporting both organic growth and shareholder return initiatives.
Historical performance (annual)
| FY | Net ($mm) | CFO ($mm) | Capex ($) | Net YoY |
|---|---|---|---|---|
| 2025 | 42 | 34 | 1532000 | +308.4% |
| 2024 | 10 | 57 | 1156000 | +64.8% |
| 2023 | 6 | 53 | 1415000 | -11.6% |
| 2022 | 7 | 34 | 1272000 |
Source: SEC companyfacts cache [F1].
Capital returns and efficiency (annual)
| FY | Buybacks ($mm) | FCF ($mm) | ROE% |
|---|---|---|---|
| 2025 | 32 | 32 | 11.6 |
| 2024 | 16 | 56 | 2.9 |
| 2023 | 9 | 52 | 1.9 |
| 2022 | 5 | 32 | 2.3 |
Source: SEC companyfacts cache [F1].
Building on a Diverse Portfolio: Loan Mix and Investment Income Dynamics
Sierra Bancorp’s moat is substantially anchored in its diversified loan portfolio segmented primarily across commercial loans; commercial residential real estate; farmland; other real estate loans; and some consumer lending segments [S1][S2]. This segmentation mitigates concentration risk—a key concern for regional banks—and provides a blend of weighted average yields based on varying loan tenors and collateral types.
The commercial loans contribute consistent interest margins often benefiting from shorter-term origination pace aligned with economic activity cycles. Meanwhile, residential real estate loans offer seasoning benefits due to amortizing structures building equity over time reducing credit risk exposure gradually.
Farmland lending remains an interesting diversification vector—relatively niche but often backed by tangible assets with moderate volatility which can complement cyclical downturns elsewhere in the portfolio.
Further income stability derives from Sierra Bancorp’s substantial investment securities holdings totaling near $891 million at end of Q3 FY2025 [S6], comprising government agency debt securities plus corporate bonds rated investment grade [S20]. These investments support yield while balancing liquidity requirements.
Complementing these is bank-owned life insurance (BOLI) valued at approximately $68.7 million as of late-2025—a strategic asset generating tax-advantaged recurring income that buffers net interest margin compression risks inherent in traditional lending operations [S6].
This layered income model supports total net interest income while reducing dependency on any single asset class performance or economic sector stresses.
Evaluating Risk Exposure: Credit Risk Considerations
Credit risk is front and center given Sierra Bancorp's loan portfolio profile with exposures spread across commercial real estate development risks and farmland lending subject to agricultural commodity cycles [S29][S5]. The company maintains an allowance for credit losses on loans close to $25 million with slight year-over-year fluctuations reflecting management’s appraisal of emerging credit trends [S6]. Diligent credit risk segmentation across performing loans versus those identified as substandard or special mention allows the bank to actively provision against potential defaults without excessive reserves that would hamper profitability.
Market risk encompasses fluctuations within available-for-sale securities and fair value changes impacting comprehensive income components [S29]. The investment grade rating profile helps reduce volatility; however investor access to capital markets liquidity remains monitored closely amid secondary trading environments.
Risk mitigation strategies described encompass regular stress testing—though specifics are proprietary—and maintaining strong capital ratios allowing buffers against unexpected credit events or interest rate shocks [S29].
Looking Ahead: Growth Opportunities and Constraints from Company Insights
Management commentary around early-2026 investor communications emphasized cautiously optimistic growth assumptions tempered by macroeconomic uncertainties such as persistent inflation pressures and evolving regulatory compliance demands [N1][N2][S3]. Loan demand outlook includes potential pickup within commercial real estate refinancing tied closely to local economic conditions.
Deposit composition trends—split between noninterest-bearing accounts ($1.07 billion) versus interest-bearing deposits ($1.86 billion)—offer stable funding cost advantages if maintained or expanded [S6]. However competitive pressures among regional banks for core deposits could limit margin expansions.
Potential constraints also stem from ongoing credit risk monitoring requirements which may cap aggressive loan expansion unless backed by strong collateralization or higher yielding segments like specialized farmland lending.
On balance sheet improvement fronts lie opportunities for targeted technology investments enhancing efficiency as suggested by incremental capex spend without large scale infrastructure upgrades evident yet [F1].
Investors should watch evolving metrics such as net interest margin shifts—as influenced by yield curve dynamics—and nonperforming asset movements as barometers of operational effectiveness going forward [N6][N7].
Capital Deployment and Shareholder Returns: Buybacks, Dividends, and ROE
Capital allocation over recent years underscores Sierra Bancorp’s commitment to returning value through both share repurchases and dividends while supporting equity growth organically.
Net share repurchases surged materially to approximate $31.8 million in FY2025 compared with $15.8 million a year earlier—a doubling indicative of confidence in intrinsic value accretion beyond opportunistic stock price levels [F1][S19][S28]. Meanwhile dividends have been paid consistently though at more conservative levels historically with no major hikes announced but continuing steadily into recent periods referenced via news coverage on dividend relevance among peer banks [F1][N7].
With FY2025 net income against end-of-year equity capital approximating an annualized return on equity near 11.6% this reflects efficient use of shareholder funds given Sierra Bancorp’s business model focused on niche market lending combined with prudent risk management frameworks [F1]. Such ROE levels are respectable within mid-sized regional banking contexts where competitive pressures moderate margin expansions but stable fee streams bolster baseline profitability.
Free cash flow conversion—estimated as operating cash flow minus capex—yielded around $32.17 million reinforcing internally generated cash capacity for further buybacks or opportunistic investments without excessive reliance on external financing sources [F1].
Disclaimer: This is research-only, informational analysis and not investment advice. It may include AI-generated interpretation and general industry context. Always verify important details using primary sources.
Comments