
Financial Strength and Integration: HBT Financial’s Growth Through Acquisition
HBT Financial accelerates regional banking expansion through CNB Bank acquisition alongside disciplined capital allocation.
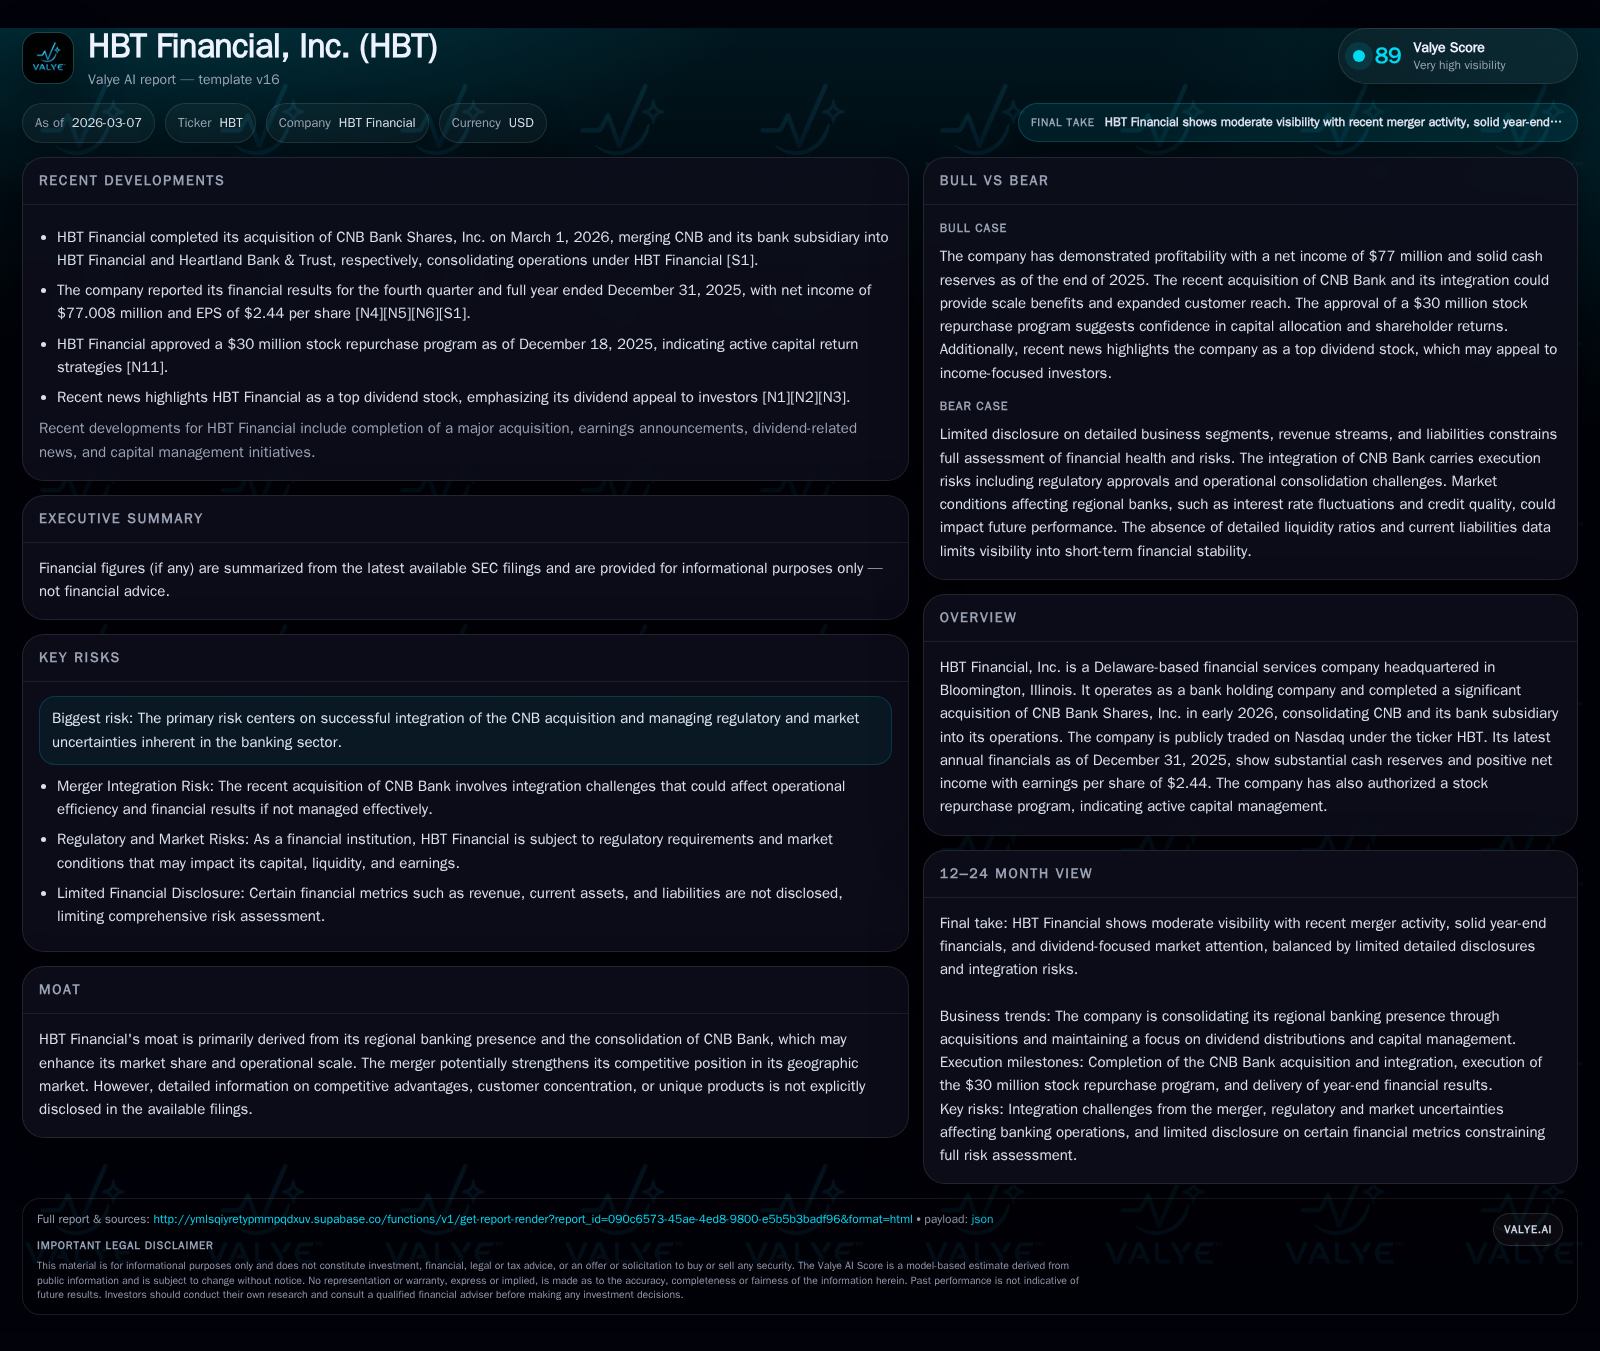
HBT Financial, Inc. has bolstered its market footprint following the acquisition of CNB Bank Shares, Inc., completed in March 2026. Historical metrics reflect steady financial performance with net income growing at a 7.3% compound rate through 2025, while equity expanded significantly. Despite some operating cash flow contraction due to integration costs, the company maintains a strong liquidity profile and committed capital returns via dividends and a new $30 million stock repurchase program. Risks largely revolve around integration challenges and regulatory compliance amid an evolving banking landscape.
The Evolution of HBT Financial: Historical Growth and Profit Drivers
HBT Financial has demonstrated consistent financial growth over recent years, with net income expanding from approximately $56.5 million in fiscal year (FY) 2022 to about $77 million in FY 2025—a compound annual growth rate near 7.3% [F1]. Alongside increasing profitability, the bank's equity base grew robustly by nearly one-third over the same period, from roughly $374 million to $615 million at year-end 2025 [F1]. This expansion reflects retained earnings accumulation supported by solid net margins typical in the regional banking sector.
Operating cash flows exhibited variability; although CFO peaked near $89 million in FY 2024, it retracted modestly to about $85 million in FY 2025 representing a -4.8% change year-over-year [F1]. This decline coincides with early costs associated with merging and integrating operations, an important consideration given recent strategic developments.
Such historical performance suggests that HBT Financial has managed organic growth with an eye on capital preservation and profitability enhancement—hallmarks of effective community bank stewardship.
Historical performance (annual)
| FY | Net ($mm) | CFO ($mm) | Net YoY |
|---|---|---|---|
| 2025 | 77 | 85 | +7.3% |
| 2024 | 72 | 89 | +9.0% |
| 2023 | 66 | 66 | +16.6% |
| 2022 | 56 | 73 |
Source: SEC companyfacts cache [F1].
Capital returns and efficiency (annual)
| FY | Div ($mm) | Buybacks ($mm) | ROE% |
|---|---|---|---|
| 2025 | 27 | 5 | 12.5 |
| 2024 | 24 | 4 | 13.2 |
| 2023 | 22 | 9 | 13.5 |
| 2022 | 19 | 5 | 15.1 |
Source: SEC companyfacts cache [F1].
Table illustrates steady earnings growth coupled with rising equity and consistent capital returned to shareholders through dividends and share repurchases [F1].
Acquisition Impact: CNB Bank Merger as a Catalyst for Scale
On March 1, 2026, HBT Financial consummated the acquisition of CNB Bank Shares, Inc., an Illinois-based institution, expanding its operational footprint significantly within the state [S3][S23]. The legal structuring involved MergerCo (a Delaware entity wholly owned by HBT) merging first into CNB, followed immediately by CNB merging into HBT Financial itself—preserving HBT as the surviving corporate entity [S3][S23].
This combination effectively consolidated CNB Bank & Trust with Heartland Bank & Trust under HBT’s auspices, optimizing branch network consolidation—a critical lever for cost efficiencies and enhanced deposit gathering capability within local markets [N1][S23].
Transaction consideration totaled approximately $34 million in cash alongside roughly 5.5 million shares issued, reflecting a hybrid payment structure that balances immediate liquidity demands with longer-term equity adjustments [S23]. The strategic rationale targets accretive expansion by broadening depositor bases and leveraging shared services across the combined franchise—a well-recognized synergy avenue in regional banking mergers.
Profitability and Cash Flow Trends In Context of Market Conditions
Despite robust net income growth into FY2025, operating cash flow declined slightly (-4.8%) likely related to merger expenses and working capital changes accompanying integration efforts [F1][N8]. Factoring industry dynamics such as fluctuating net interest margins caused by rate cycles, the positive bottom-line signals effective management of lending spreads and deposit costs.
Recent quarterly reports note lower bottom-line contributions when isolating certain expense categories connected to acquisition activities but affirm underlying earnings strength [N8][N2]. This pattern matches typical consolidation phases where short-term cash flow pressures coexist with medium-term scale benefits.
Capital Management Discipline: Dividends, Buybacks, and Liquidity
HBT has maintained shareholder-friendly capital policies as evidenced by incremental dividend raises—from $0.21 per share quarterly at late-2025 towards $0.23 per share announced early-2026—and adoption of a fresh $30 million stock repurchase program effective January through December 2026 [S8][S13][S19][N4]. Annual dividends paid have risen consistently from $18.6 million (FY2022) to $26.6 million (FY2025), illustrating commitment to steady income distribution alongside balance sheet strengthening via equity retention [F1].
Share repurchase activity moderated recently after elevated levels in FY2023 but remains an active tool within capacity constraints linked to regulatory limits on capital usage [F1][S11]. Cash on hand stood at about $122 million at FY-end 2025 providing ample liquidity buffer during integration [F1].
This approach encapsulates balanced capital stewardship prioritizing both investment in growth initiatives and rewarding shareholders without compromising regulated capital thresholds.
Risk Factors Centered on Integration and Regulatory Environment
The largest material risks center on successful integration execution encompassing IT systems harmonization, cultural alignment between legacy teams, and realigning operational policies under unified governance structures as outlined in risk disclosures [S6][S1][S4]. Failure modes include disruption to customer service or unforeseen expense inflation diminishing synergy realization.
Compliance challenges derive from enhanced scrutiny typical of aggregated regional players including ongoing adherence to stress-testing requirements and maintaining liquidity coverage ratios amidst shifting market conditions [S6][S7]. Credit risks remain ever-present given potential economic shifts impacting borrower creditworthiness during transition phases.
Mitigation strategies focus on staged merger implementation combined with transparent regulatory communication consistent with industry best practices for bank consolidations.
Key Milestones to Monitor Post-Merger Implementation
Crucial forthcoming events encompass HBT's quarterly reporting cycles—particularly Q1 and Q2 results expected mid-2026—to gauge operational integration success through earnings quality metrics and cost-to-income ratio trends [N9][S15]. Dividend declaration schedules aligned with board meetings remain important checkpoints for signaling confidence levels.
Additionally, any updates on regulatory approvals or adjustments in supervisory expectations bear watching as they materially influence strategic flexibility post-close [S3][S14]. These metrics collectively offer practical indicators for assessing trajectory beyond headline transaction completion.
This analysis refrains from investment guidance; it synthesizes publicly filed data reflecting HBT Financial's strategic trajectory following a transformative acquisition enhancing its scale while underscoring measured capital discipline amid inherent sector risks.
Disclaimer: This is research-only, informational analysis and not investment advice. It may include AI-generated interpretation and general industry context. Always verify important details using primary sources.
Comments