
Nayax Ltd. Drives Profitability Through Platform Expansion and Recurring Revenue Growth
Nayax leverages an integrated commerce platform serving diverse global verticals, with strong SaaS and payment fee growth driving a profitable 2025.
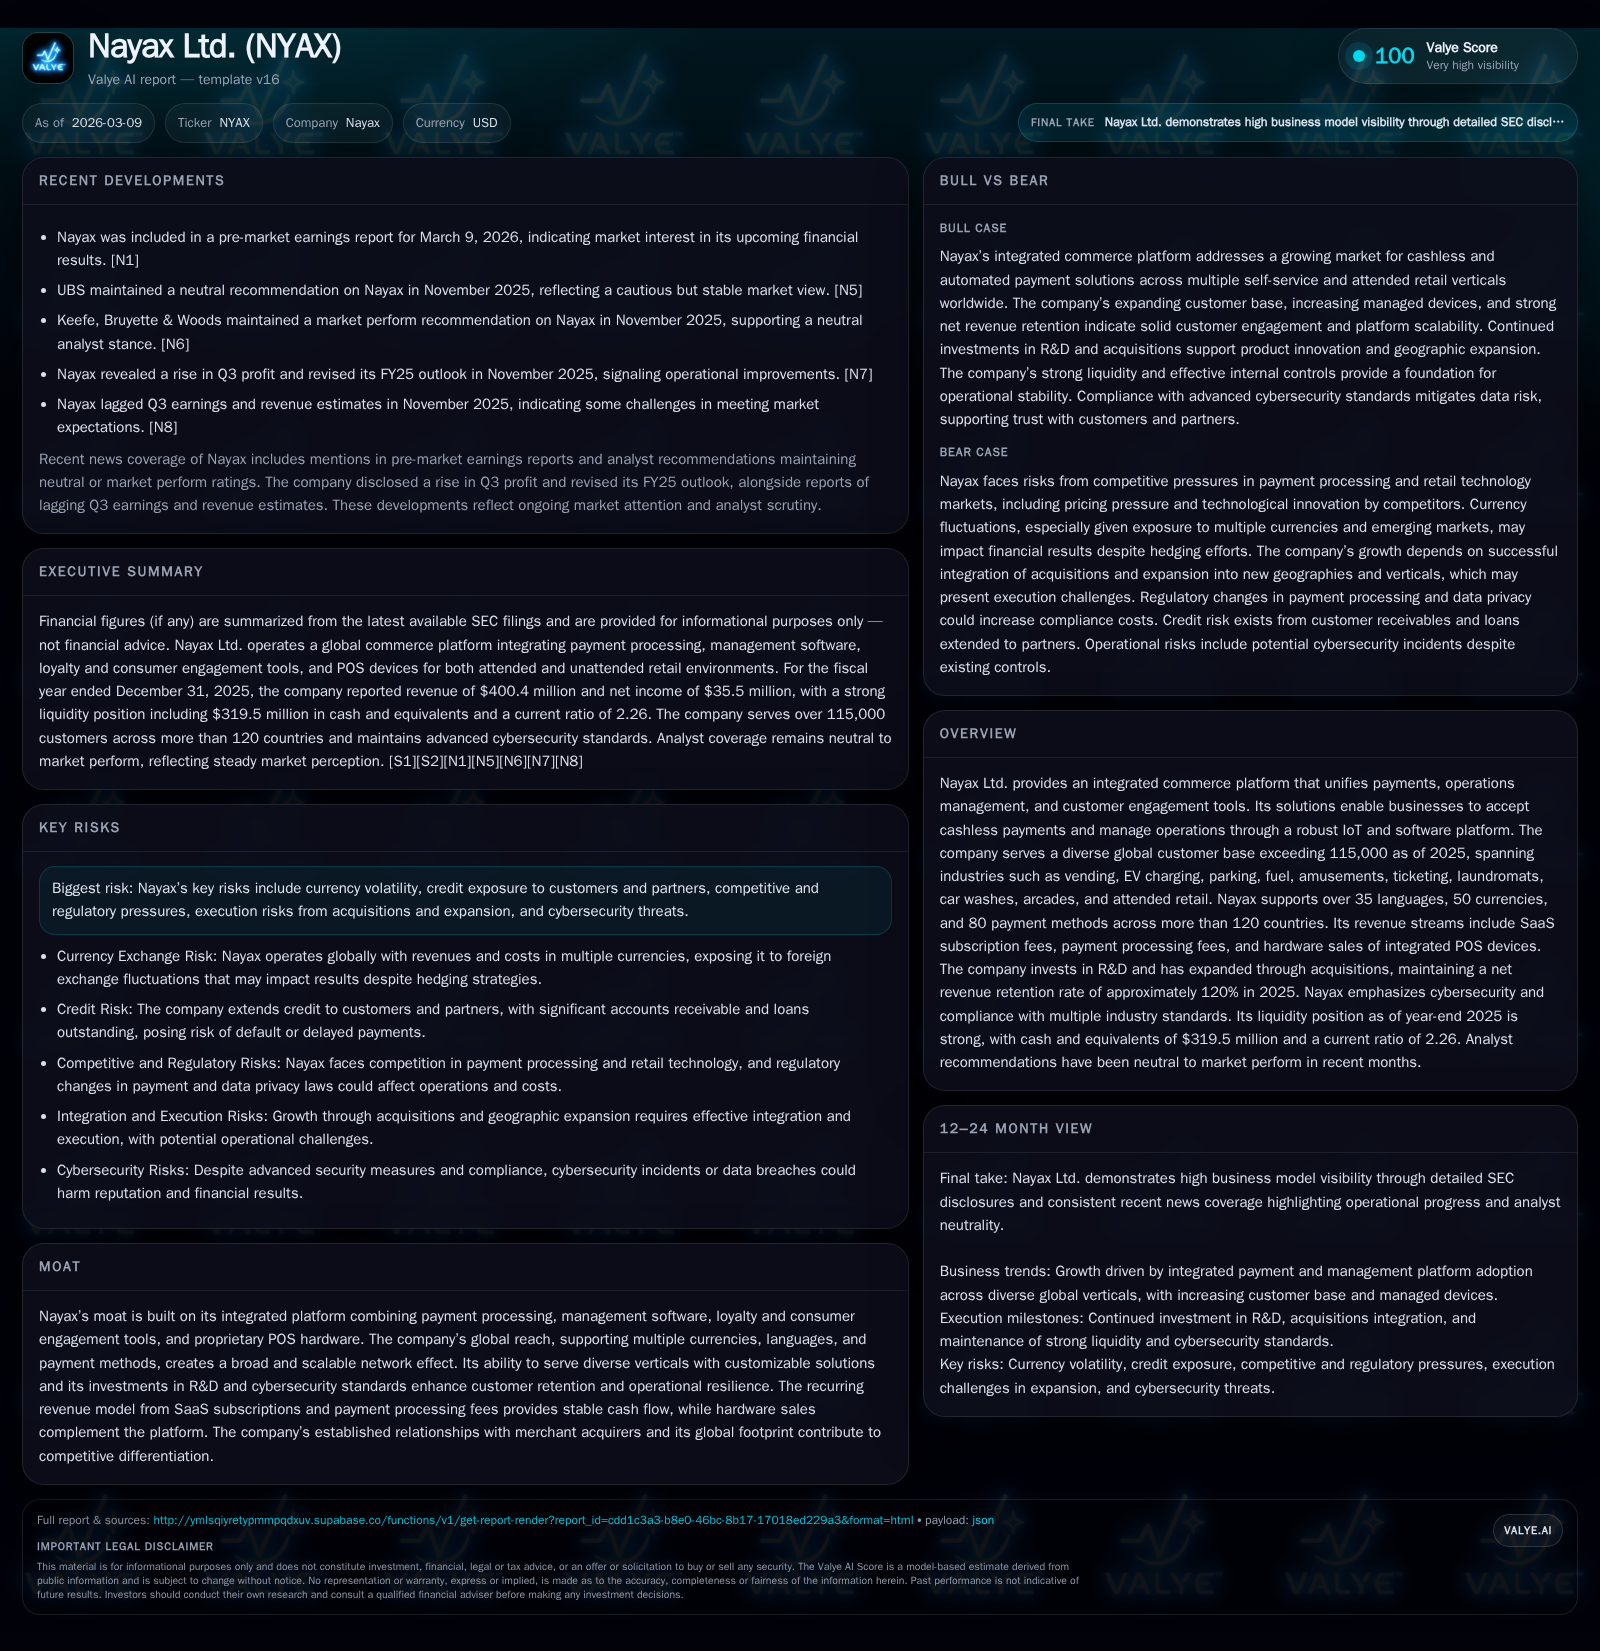
Nayax Ltd., a provider of an integrated payments and operations management platform, achieved significant revenue growth of 27.5% in 2025, reaching $400.4 million, driven by a growing customer base exceeding 115,000 globally. Recurring revenue from SaaS subscriptions and payment processing fees reached $287.2 million, marking an increase in gross margin and improved operating leverage. The company delivered a net income of $35.5 million in 2025, turning around prior losses, supported by operational efficiencies and successful acquisitions expanding its solution footprint. Risks remain around foreign currency exposure, regulation, and competitive pressure.
Company Overview
Nayax Ltd. operates an integrated commerce platform combining payment processing, operational management software, customer engagement tools like loyalty programs, and proprietary integrated POS hardware [S1][S5]. Serving a diverse base of roughly 115,000 customers worldwide as of December 31, 2025—up significantly from approximately 72,000 in just two years—the company supports over 80 payment methods across more than 120 countries [S1][S18]. Industries served include vending machines, EV charging stations, parking, fuel retailing, amusements, laundromats, car washes, arcades, ticketing, kiosks, self-checkouts and increasingly attended retail environments [S1].
The platform's value proposition hinges on delivering scalable cashless payment acceptance alongside remote management capabilities powered by IoT connectivity embedded within its POS devices [S1][S13]. This interconnected system enables merchants to optimize operational efficiency while enhancing consumer loyalty through digital engagement apps such as Monyx Wallet [S5].
Historical Performance and Revenue Drivers
Nayax's top-line growth has been robust over the last several years as shown in the table below:
Historical performance (annual)
| FY | Rev ($mm) | Net ($mm) | Rev YoY | Net YoY |
|---|---|---|---|---|
| 2025 | 400 | 36 | +27.5% | +730.7% |
| 2024 | 314 | -6 | +33.3% | +64.6% |
| 2023 | 235 | -16 | +35.7% | +57.6% |
| 2022 | 174 | -38 |
Source: SEC companyfacts cache [F1].
Capital returns and efficiency (annual)
| FY | ROE% |
|---|---|
| 2025 | 15.4 |
| 2024 | -3.4 |
| 2023 | -16.3 |
| 2022 | -35.8 |
Source: SEC companyfacts cache [F1].
Source: [F1]
Revenue composition highlights persistent recurring revenue streams from software subscriptions (SaaS Revenue) and payment processing fees that accounted for nearly three-quarters of total revenue (71.7%) in FY2025 [S1][S21]. The SaaS segment alone increased by approximately $24.6 million or +28% year-over-year to $113.1 million driven by device volume expansion and pricing tier adoption [S1]. Payment processing fees grew similarly at +30%, totaling $174.1 million by end-2025 due to higher transaction volumes across global client sites [S1][S21]. Hardware sales meanwhile surged sharply in dollar terms due to greater unit shipments but contracted as a share of total revenue to about 28% reflecting strong recurring focus [S1].
Gross profit improvement was driven by both top-line growth and efficient cost management: gross margin rose from about 45.1% in FY2024 to roughly 48.2% in FY2025 [S11]. Manufacturer cost optimizations amid better supply chain conditions reduced POS device production expenses despite volume increases [S4][S10]. Additionally smart-routing improvements reduced payment processing costs allowing incremental margin expansion on the recurring revenue base [S11].
Unit Economics and Operating Leverage
Cost of revenues totaled approximately $207 million (up ~20%), segmented mainly between hardware manufacturing (35% of cost), payment processing (52%), and SaaS delivery/support costs (13%) [S10][S11]. While hardware costs rose with volume increases, improvements in product design offset material price inflation to yield rising gross margins [S4]. Payment processing costs advanced with transaction volume but benefited from ongoing contract renegotiations with merchant acquirers reducing effective fees paid out [S10]. Investment into SaaS infrastructure continued supporting customer experience though with some margin pressure typical for scaling software platforms [S10].
Research and development expenses climbed nearly $5 million year-over-year to $30 million highlighting commitment to innovation especially around IoT integration and new client-facing features [S6][S20]. Selling general & administrative costs also grew moderately due to expanded sales teams for new verticals and geographies plus acquisition-related spending [S6][S20]. Despite these investments, operating profit before financial results improved sharply to nearly $38 million reflecting strong scaling benefits [F1][S20].
Capital Structure and Cash Flow
As of FY2025 the company maintained a healthy liquidity position with cash & equivalents around $320 million against current liabilities of about $274 million for a current ratio exceeding two times [F1]. Nayax raised substantial capital during the year via Series A Note offerings aggregating over $300 million proceeds used partially for acquisitions as well as balance sheet strengthening [S3][S7][S24].
Operating cash flow benefited from expanded recurring revenues faster than operating expense increases alongside efficiency gains described above leading to positive free cash flow generation potential despite ongoing investments in R&D and capital expenditures for property & equipment supporting technology platforms [F1][S16][S25]. The company also manages foreign currency risk actively through derivatives though residual volatility remains a noted risk given the global footprint including emerging markets exposure [S12][S14].
Customer Base Expansion and Platform Adoption
Nayax's customer count surged from about 72,000 at end-2023 to approximately 115,000 at end-2025 evidencing strong market acceptance across the unattended self-service segment principally vending plus adjacent segments like EV charging where demand is accelerating rapidly internationally [S1][N1]. The company's multi-lingual, multi-currency platform supports over fifty currencies facilitating easy regional adaptation.
Notably the net revenue retention rate stood at roughly 120% indicating effective cross-selling and upselling within installed bases coupled with low churn—a vital indicator of platform stickiness given switching costs on mixed hardware-software deployments are high [S23]. Expansion into attended retail POS solutions broadens addressable market categories incorporating small-to-medium businesses seeking integrated payment plus customer engagement solutions—an area expected to grow over coming years leveraging the existing IoT infrastructure footprint [S18][N1].
Strategic Acquisitions Fueling Growth
Throughout FY2024–FY2025 Nayax acquired several companies including Roseman Engineering, VMT (mid-2024), Uppay Inepro Pay & Lynkwell (various points in FY2025), Tigapo & IoT share increases further consolidating control over key tech assets related to payments platforms and engineering capabilities [S6][S9][N1]. These acquisitions enhance product breadth covering expanded P2PE security tech stacks and geographies while increasing scale rapidly.
Integration execution risk exists but early signs point toward synergies via unified R&D efforts led by expanded headcount (~$11M increment in employee expenses since prior year related mostly to acquisitions) alongside consolidated sales channel optimization allowing quicker go-to-market rollout for new verticals particularly EV charging & attended retail segments where scale economies become pressing with global clients running thousands+ terminals each[S6][S18].
Industry Context & Future Growth Prospects
The global shift from cash-based transactions toward digital contactless payments underpins Nayax’s long-term secular growth opportunity worldwide; unattended retail environments have seen fast adoption curves exacerbated by pandemic-driven behavioral changes whereas attended retail remains fragmented but increasingly digitizing their POS infrastructures requiring integrated cloud SaaS control layers hosted via secure IoT linked devices—exactly Nayax’s core competence .[S18]
Key concerns for sustainability include maintaining device hardware manufacturing efficiency amid potential component tariff hikes or logistic disruptions which could impact margins if prices rise sharply beyond contract ceilings or legacy supplier relationships falter.[S17] Regulatory changes affecting cross-border data flows or new local licensing regimes may elevate compliance costs.[S14] Currency volatility remains material given USD weakening vis-à-vis Euro & NIS observed last year requiring continued hedging efforts.[S12] Competition intensifies as larger incumbents build unattended payments capabilities while fintech startups introduce niche disruptive models demanding agile innovation.
Key Milestones To Watch
- Customer count trajectories particularly expansion into attended retail locations.
- Recurring revenue split progression signaling deeper wallet share gains within installed base.
- Hardware margin trends amidst supply chain normalization or shocks.
- Integration progress of recent acquisitions capturing synergy realization.
- R&D pipeline outputs delivering next-gen IoT-enabled services/platform updates.
- FX hedge effectiveness managing currency headwind impacts.
- Regulatory developments influencing cross-border payments operations.
Returns & Capital Allocation Overview
Nayax turned profitable at the net income line achieving $35.5 million profit for full-year FY2025 vs prior losses confirming operational leverage from scale combined with disciplined cost controls post-acquisition investment phase[F1]. The resulting return on equity approximated a solid ~15%, markedly improved versus negative returns previously.[F1] Cash flow strength supports ongoing R&D spend around the $30 million annual run rate plus moderate capital expenditure necessary for supporting internal development tools/processes plus field operation equipment[S20][S25].
Despite positive earnings generation no dividends were declared consistent with an investment-in-growth posture subject to debt covenant restrictions linked to note agreements entered during recent financing rounds[S3][S24]. Repurchases activity not disclosed suggesting no active buyback program currently.
Risks Summary
Nayax identifies key risks mainly relating to foreign exchange fluctuations particularly impacting reported results despite hedging programs,[S12] credit risk inherent with extending terms or loans to customers,[S12] cybersecurity threats due to handling sensitive financial data subject to multinational regulatory regimes[S14][S23], intense competitive pressures pushing pricing/talent battles,[S14], execution risks melding multiple recent acquisitions towards unified offerings[S6]. Geopolitical uncertainties influencing supply chains or market access may add volatility too[S17]. These necessitate proactive risk mitigation frameworks embedded throughout operations.
Conclusion
By effectively integrating multi-modal payments acceptance hardware with sophisticated cloud-hosted telemetry/software analytics complemented by consumer engagement tools spanning loyalty programs Nayax Ltd has established itself as a diversified participant poised for continued growth across multiple automated commerce verticals globally. Strong historical growth rates coupled with meaningful profitability turnaround signal improving operational maturity while strategic acquisition deployments deepen platform breadth enhancing competitive defensibility. Emerging opportunities anchored on expansion into attended retail environments coupled with new geographies complement underlying secular tailwinds favoring digital commerce transition worldwide. Nevertheless prudent monitoring of macroeconomic headwinds along with regulatory evolution remains essential given ongoing globalization complexities intrinsic to Nayax’s business model.
This analysis is based solely on publicly available information without any investment recommendation or advice regarding Nayax Ltd.
Disclaimer: This is research-only, informational analysis and not investment advice. It may include AI-generated interpretation and general industry context. Always verify important details using primary sources.
Comments