
Cerus Corporation’s Turnaround: From Net Losses to Growth Momentum
Cerus Corporation demonstrates a compelling balance between accelerating product revenue growth and ongoing profitability challenges within its specialized biotech niche.
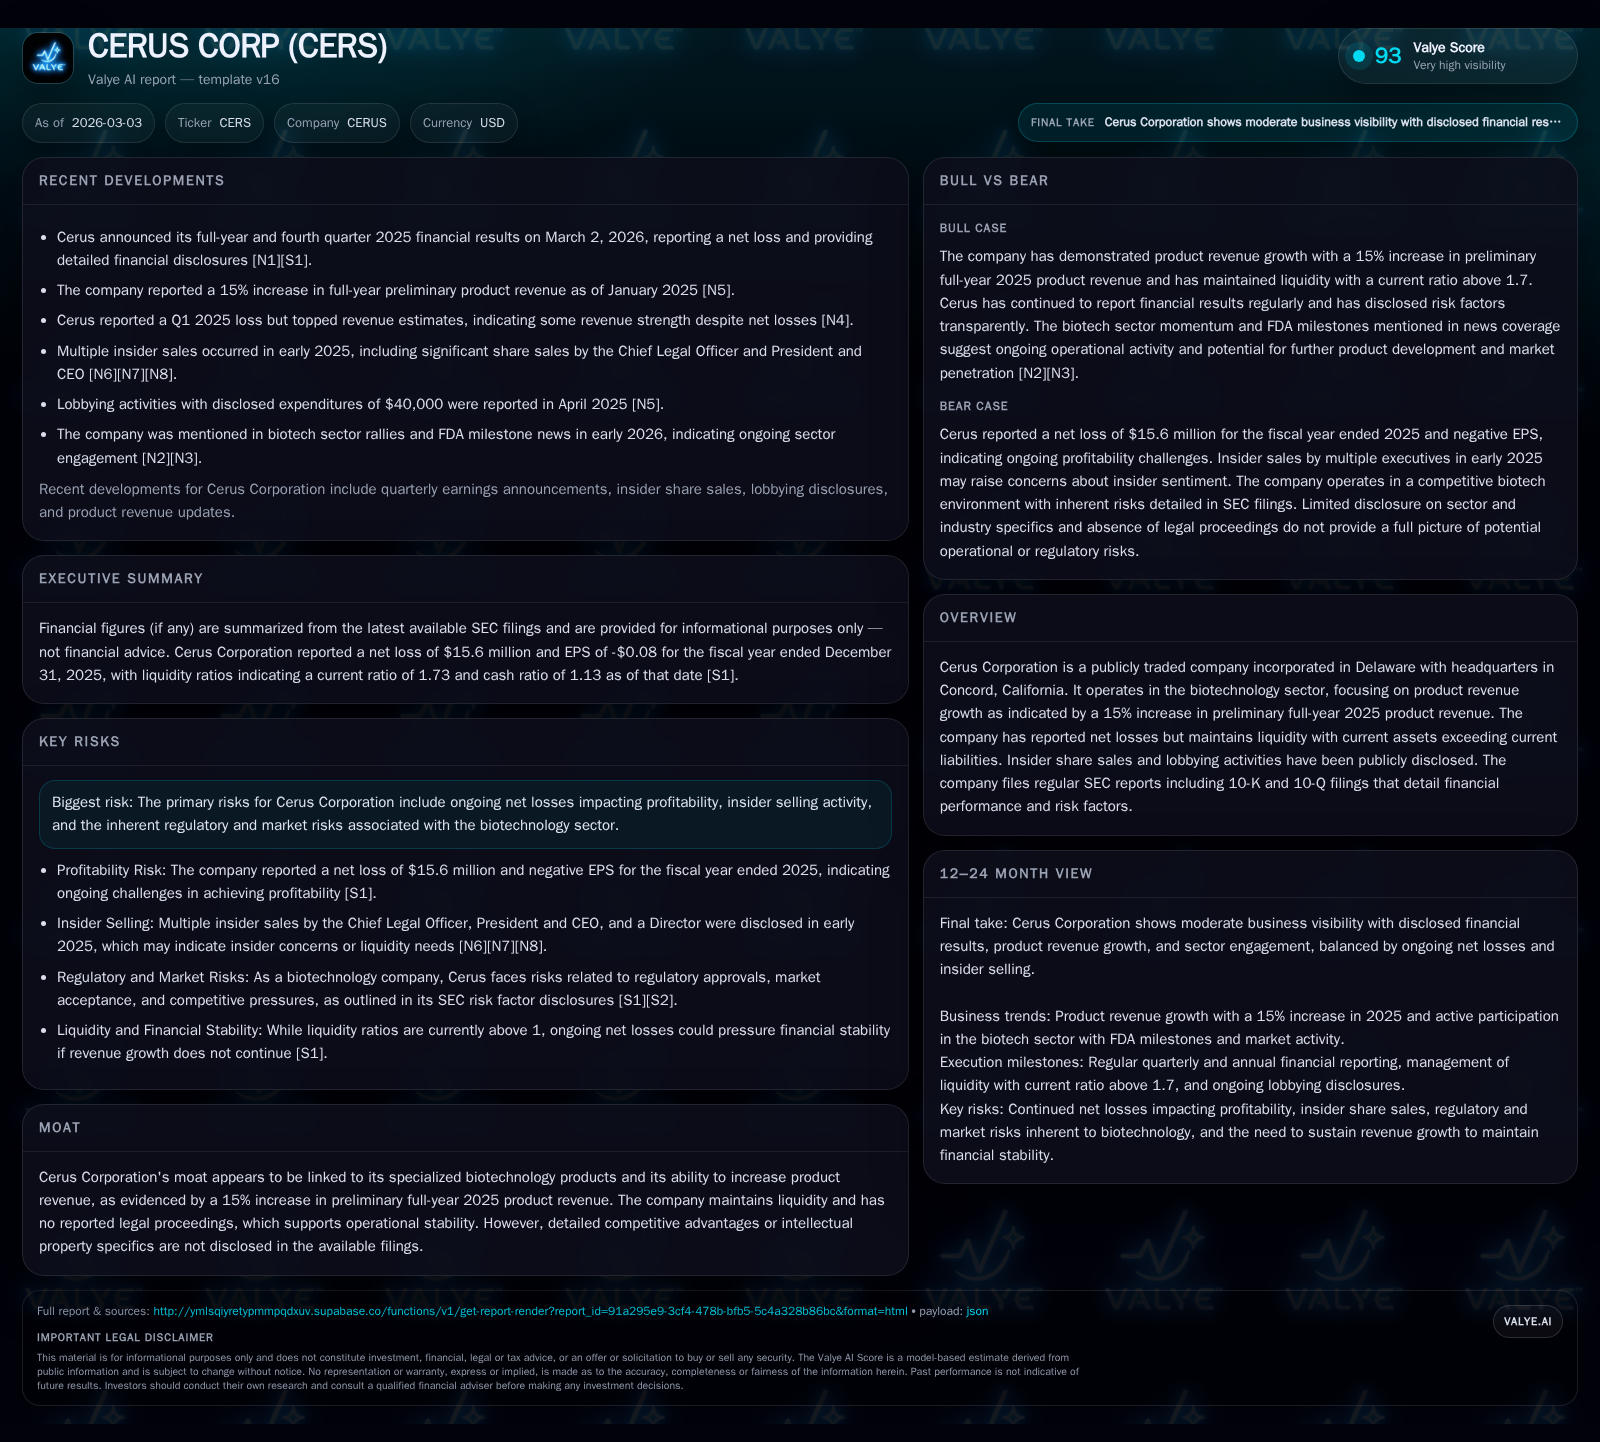
Cerus Corporation has recorded a significant preliminary increase in product revenues for full-year 2025, marking a notable step in top-line growth after several years of flat to modest expansion. Despite this revenue acceleration, the company continues to operate at a net loss, reflecting persistent operating inefficiencies common in biotechnology commercialization phases. Liquidity remains strong with a current ratio above 1.7, supporting an ongoing investment runway amid regulatory and market risks. Capital allocation focuses on measured capex and cautious cash flow management as Cerus navigates the path from revenue momentum toward sustainable profitability.
Historical Revenue and Profitability Trends Highlight Biotech Challenges
Cerus Corporation's financial history reflects typical biotechnology dynamics: modest historical revenue growth paired with sustained net losses driven by R&D and commercialization expenses. Revenue grew from $39.3 million in fiscal year 2016 to $51.3 million in 2017, representing early growth momentum [F1]. Recent disclosures indicate a preliminary approximate 15% increase in product revenue for full-year 2025, signaling renewed commercial traction [N1][S17].
Operating income has remained negative but improved significantly from -$34.1 million in 2022 to -$8.7 million at the end of 2025 [F1], indicating operational tightening though still short of profitability. Net income followed a similar trend, improving from -$42.8 million in 2022 to -$15.6 million in 2025 [F1], underscoring ongoing progress toward break-even.
This progression aligns with typical biotech commercialization cycles where upfront investments precede sustainable cash generation amid regulatory hurdles.
Drivers Behind the 2025 Product Revenue Acceleration
The reported preliminary ~15% increase in product revenue for full-year 2025 is primarily attributed to expanded market penetration of Cerus' existing biotechnology platforms rather than new product launches or major pipeline developments [N1][S1][S2]. Earnings call commentary highlights intensified sales efforts and growing adoption among blood centers globally, consistent with the company's focus on pathogen reduction technology to enhance blood safety [N1].
Limited disclosures on innovative pipeline progress suggest the company emphasizes scaling established IP through customer engagement and distribution partnerships rather than relying on disruptive clinical approvals during this period [S1]. This approach reflects pragmatic growth management common among biotech firms navigating complex regulatory environments.
Liquidity Position and Balance Sheet Stability Amid Operating Losses
Despite recurring net losses, Cerus maintains robust liquidity supported by $174 million in current assets against $101 million in current liabilities as of December 31, 2025, yielding a healthy current ratio of approximately 1.73 [F1][S9]. Cash and equivalents stand near $20 million, providing operational flexibility.
SEC filings reveal no significant debt maturities or adverse capital structure events undermining balance sheet stability through late 2025 and early 2026 [S9][S10][S11][S15], reflecting disciplined financial management amid challenging sector economics.
This liquidity runway supports ongoing R&D investments and commercialization initiatives while absorbing near-term losses inherent to biotech maturation phases.
Growth Outlook Amid Regulatory and Market Risks
Cerus faces typical opportunities and constraints for specialized biotech firms. Regulatory compliance demands remain stringent with complex clinical validation impacting potential time-to-market accelerations or expansions into adjacent areas [S4][S5][S6][S8]. Market competition exists but Cerus' focus on pathogen reduction technology helps differentiate it within blood safety protocols.
No legal proceedings have been reported, indicating operational stability despite insider selling activity noted by regulators which may warrant cautious monitoring [S4]. Navigating these challenges will require calibrated execution commercially alongside robust regulatory engagement.
Capital Allocation: Cash Flow, Investment, and Shareholder Returns
Capital allocation prioritizes measured investments aligned with scaling production capabilities alongside improving operating cash flow profiles. Operating cash flow improved from significant negatives (e.g., -$43 million in FY2023) into positive territory at $4.8 million for FY2025 [F1], reflecting better operational efficiencies or timing improvements.
Capital expenditures rose moderately by approximately 31% year-over-year to nearly $3.7 million in FY2025 supporting manufacturing ramp-up demands [F1]. Return on equity remains negative at about -24% due to continued net losses despite equity growth via financing rather than retained earnings accumulation [F1].
No dividends or share repurchase programs have been initiated; capital deployment prioritizes liquidity conservation and reinvestment over direct shareholder returns during this profit transition phase [S19].
Key Metrics Table: Financial Performance Snapshot (2017–2025)
Historical performance (annual)
| FY | Net ($mm) | CFO ($mm) | OpInc ($mm) | Capex ($mm) | Net YoY |
|---|---|---|---|---|---|
| 2025 | -16 | 5 | -9 | 4 | +25.3% |
| 2024 | -21 | 11 | -14 | 3 | +44.2% |
| 2023 | -37 | -43 | -30 | 5 | +12.4% |
| 2022 | -43 | -26 | -34 | 2 |
Source: SEC companyfacts cache [F1].
Capital returns and efficiency (annual)
| FY | FCF ($mm) | ROE% |
|---|---|---|
| 2025 | 1 | -24.3 |
| 2024 | 9 | -37.3 |
| 2023 | -48 | -71.2 |
| 2022 | -28 | -63.3 |
Source: SEC companyfacts cache [F1].
*Revenue YoY based on preliminary estimate; all other figures final per latest SEC filings [F1],[N1]
Conclusion: Balancing Growth Ambitions with Profitability Realities
Cerus Corporation stands at an inflection point where its commercial momentum—in particular meaningful acceleration of product revenue growth—contrasts with persistent profitability pressures typical within specialized biotechnology sectors. Increasing product adoption underscores operational gains but converting these into sustainable profits requires continued discipline across regulatory navigation and cost management.
Robust liquidity provides runway to execute strategic priorities amidst sector uncertainties including compliance demands and competition. Capital allocation favors reinvestment over shareholder distributions supporting longer-term value creation potential.
Overall, Cerus illustrates classic biotech progression dynamics—early-stage revenue breakthroughs followed by gradual margin improvement—that merit close monitoring for shifts toward durable earnings generation.
Disclaimer: This is research-only, informational analysis and not investment advice. It may include AI-generated interpretation and general industry context. Always verify important details using primary sources.

Comments